Buying $SUI Like Bitcoin in 2009? $20 Key Target: Sui Price Prediction


SUI is exploding today. The token just ripped higher, up sharply on the day, and crypto Twitter is buzzing with talk of a $20 target down the line.
This Sui Price Prediction looks at whether the breakout has legs, what's driving today's move, and the levels that matter most right now. Here's the full picture.
Market data was checked on August 22, 2026, at 10:35 IST.
Sui Price Prediction 2026: Market Overview
Metric | Value |
Price | $0.93818 |
24h Change | +11.19% |
Market Cap | $3.85B |
Unlocked Market Cap | $3.85B |
FDV | $9.45B |
24h Volume | $1.19B |
Vol/Mkt Cap (24h) | 30.5% |
Total Supply | 10B SUI |
Max Supply | 10B SUI |
Circulating Supply | 4.07B+ SUI |
Source: Data from CoinMarketCap as of August 22, 2026, at 10:35 IST. Figures may vary slightly across other tracking websites.
Sui Liquidation and Volume Data
Coinglass futures data shows heavy two-sided liquidations during today's rally.
| Timeframe | Total Liquidated | Long Liquidations | Short Liquidations |
|---|---|---|---|
| 1h | $3.12M | $2.90M | $221.41K |
| 4h | $4.39M | $3.07M | $1.32M |
| 12h | $4.52M | $2.33M | $2.19M |
| 24h | $6.76M | $2.98M | $3.78M |
Longs got squeezed hardest in the early hours, but shorts caught up over 12h and 24h, pointing to a volatile, high-leverage environment on both sides.
$SUI $20 Target: What Traders Are Saying
Trader Crypto Patel shared a $SUI breakout rally anda long-term chart claiming $SUI has been quietly building an accumulation structure, with tight consolidation, higher lows, and strong dip buying points to a possible big move ahead.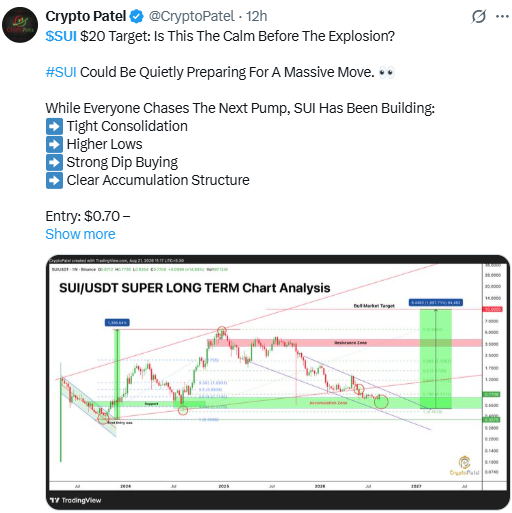
Source: Data From X
The post describes an entry zone between $0.70 and $0.50, with a target progression of $5, then $10, and eventually $20.
Note: This is an unverified personal target shared on social media, not confirmed analysis, and should be treated as one trader's outlook rather than fact.
$SUI breakout rally: Buying SUI "Like Bitcoin in 2009"?
An account called Sui Intern compared buying $SUI under $1 to early Bitcoin buyers in 2009, framing it as an early-entry opportunity.
Note: This is an unverified social media opinion, not a data-backed comparison.
$SUI Price Prediction Chart: Technical Analysis
Pair: SUI/USD · Market: Spot (Crypto) · Timeframe: 1D · Source: TradingView · Timestamp: August 22, 2026, 10:35 UTC+5:30
SUI price prediction, $Sui broke sharply higher off the $0.80222 support zone, clearing the recent range it had been stuck in since June and pushing toward the $1.04206 resistance level.
RSI sits at 81.52, deep into overbought territory, meaning today's move is stretched and a pause or pullback wouldn't be surprising even if the broader trend stays bullish.
The EMA cluster sits far below the current price, marking a longer-range floor rather than near-term resistance.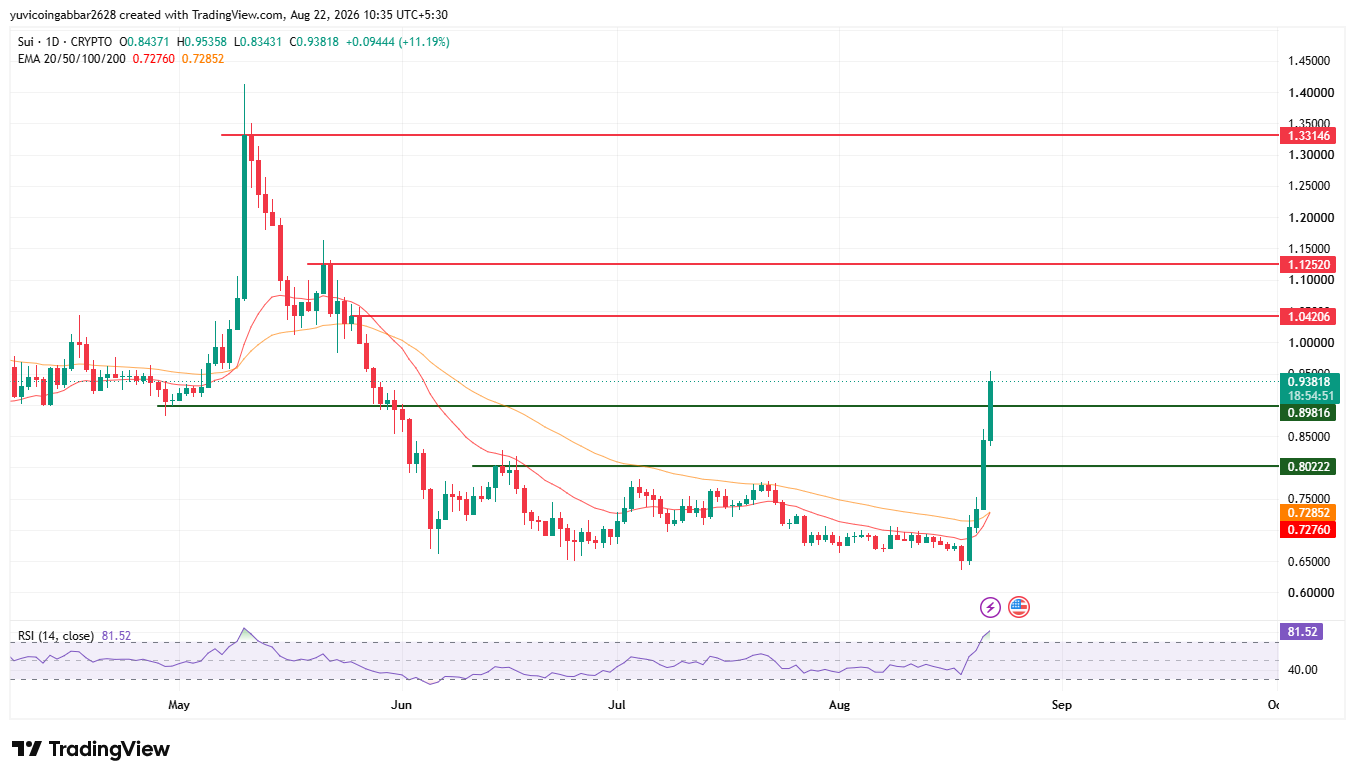
$SUI future price: Support and Resistance Levels
Level Type | Price |
Resistance 3 | $1.33146 |
Resistance 2 | $1.12520 |
Resistance 1 (nearest) | $1.04206 |
Immediate Price Reference | $0.93818 |
First Support | $0.89816 |
Deeper Support | $0.80222 |
Sui Forecast: Bull Case vs. Bear Case
$SUI price target 2026 Bull case: Holding above $0.89816 keeps today's breakout intact.
A confirmed close above $1.04206 would open the path toward $1.12520 and then $1.33146.
$SUI price target 2026 Bear case: A break below $0.89816 would suggest today's rally is fading fast, especially given how overbought RSI is right now.
Losing $0.80222 would put the entire breakout structure back in question.
$SUI Price Prediction: Scenarios
Scenario | Trigger | Likely Outcome | Invalidation Point |
Breakout continuation | Close above $1.04206 | Move toward $1.12520 | Rejection at $1.04206 |
Range hold | Price holds 0.89816–1.04206 | Consolidation before next leg | Break outside either bound |
Breakout failure | Close below $0.80222 | Retest of lower range near 0.72–0.73 | Reclaim of $0.89816 |
$SUI price target: Can $SUI Reach $20?
The $20 figure comes from social media speculation, not the chart.
The recent highest level actually marked on this chart is $1.33146, meaning $SUI would need to clear several major resistance zones and then keep multiplying well beyond anything visible here to reach $20.
That kind of move would require a sustained, multi-year re-rating rather than anything today's breakout alone can confirm.
Sui Price Prediction 2026: Expert Analysis
According to CoinGabbar analysts, today's breakout came with strong volume and a clean break of the multi-month range, a combination that usually reflects genuine buying pressure.
That said, RSI above 80 is a clear caution sign, and social media hype around big targets tends to accelerate both the rally and the eventual pullback.
The $0.89816 to $1.04206 zone is the one to watch over the next few sessions to see if this move holds.
Disclaimer: This piece is for informational purposes only and isn't financial advice. The levels and scenarios above are based on technical chart analysis and publicly available data at the time of writing, and crypto markets can move sharply within hours, so past patterns don't guarantee future outcomes. Social media targets referenced here are unverified opinions, not confirmed data. It's worth doing independent research and considering your own risk tolerance before acting on any of the levels discussed here.
Also read:











.webp)





