Why Bitcoin, Ethereum, XRP Price Crash Today: What's Behind the Drop?


Bitcoin has slipped to $76,680, down 1.56% over the past day. The crypto market crash is dragging Bitcoin, Ethereum and XRP lower too.
The trigger came fast. US forces struck Iranian targets near the Strait of Hormuz. Oil prices jumped to their highest level in 40 days.
That kind of shock tends to rattle every risk asset at once, and crypto was no exception today.
What caused the crypto market to drop today?
President Trump confirmed the strikes. He warned Iran against retaliating.
He later added he isn't trying to push Iran back to the table. He said he "couldn't care less" whether Tehran signs any deal.
Oil surged past $90 a barrel on the news. That's its highest print in roughly six weeks.
Traders are pricing in the risk of a longer disruption. The Strait of Hormuz is one of the busiest shipping lanes for global crude.
Total crypto market cap has slipped to $2.58 trillion, down 1.66% on the day. Trading volume sits at $82.4 billion.
Ethereum has fallen to $2,375, down 3.15%. XRP has dropped to $1.32, down 2.90%.
Solana is down 3.35% at $98.61. BNB has slipped 0.43% to $683.
Is the crypto Fear and Greed Index still showing greed?
Yes, but it's cooling off a bit.
The latest Fear & Greed Index reads 63, still in Greed territory. That's down from 69 yesterday.
Timeframe | Fear & Greed Score | Sentiment |
Now | 63 | Greed |
Yesterday | 69 | Greed |
Last week | 65 | Greed |
Last month | 28 | Fear |
Compare that to last month's reading of 28, which was Fear. Investor confidence has clearly improved since then.
If sentiment holds up, steady demand for digital assets could cushion the market against more headwinds.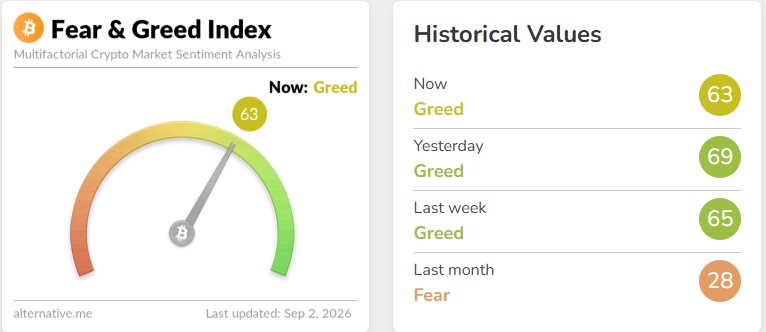
Are Bitcoin ETFs seeing outflows today?
US spot Bitcoin ETFs started September on a weak note.
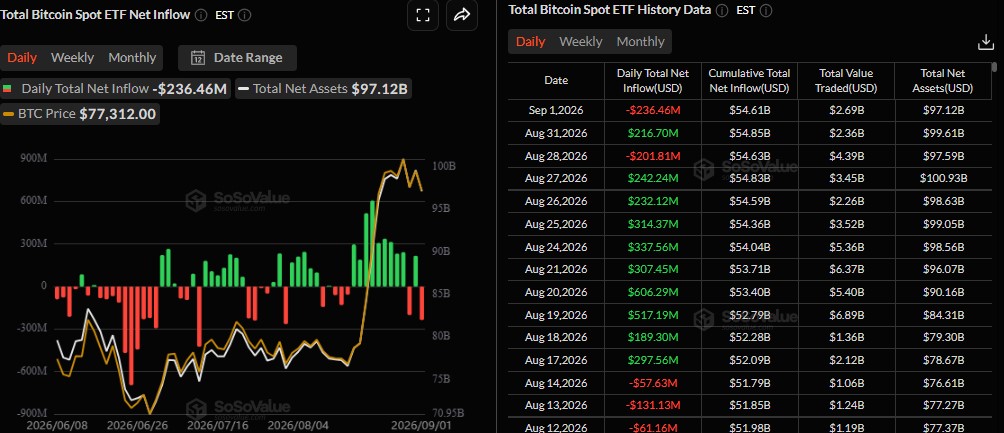
Early data shows about $236.46 million in net outflows for September 1. Only three of the 13 funds had reported at the time.
BlackRock's IBIT alone made up around $201.2 million of that outflow.
Combined with the macro fears from the Iran strikes, this ETF selling is adding extra weight on Bitcoin's price in the short term.
That said, ETF flows have already flipped once this week. Bitcoin funds pulled in $217 million just one day after that outflow streak snapped.
This back-and-forth is common when markets are digesting big macro news. It shows institutional demand hasn't disappeared, even if it looks shaky day to day.
Date | Daily Net Flow | Cumulative Net Inflow | Total Net Assets |
Sep 1, 2026 | -$236.46M | $54.61B | $97.12B |
Aug 31, 2026 | $216.70M | $54.85B | $99.61B |
Aug 28, 2026 | -$201.81M | $54.63B | $97.59B |
Aug 27, 2026 | $242.24M | $54.84B | $100.93B |
Aug 26, 2026 | $232.12M | $54.59B | $98.63B |
Are Ethereum ETF inflows still positive?
Yes, but the pace has slowed.
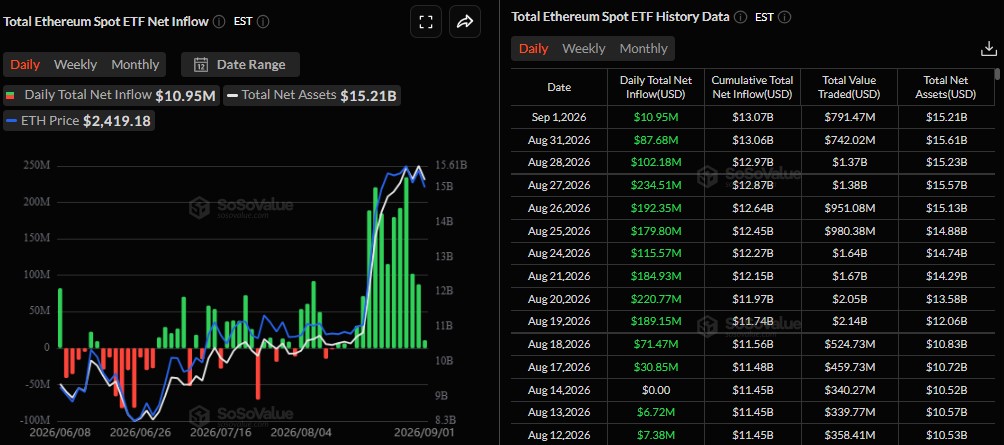
According to SoSoValue data, US spot Ethereum ETFs saw net inflows of about $10.95 million on September 1.
That marks 12 straight days of net inflows. But the daily pace has clearly cooled from the aggressive streak seen in late August.
Total net assets for Ethereum ETFs now sit at $15.21 billion, with the ETH price at $2,419.18 at the time of that data snapshot.
Are XRP ETF inflows still positive this week?
Not everything in the XRP news cycle is bearish.
The XRP ETF saw a strong start to September, pulling in $14.38 million in net inflow on the first day of the month alone.
Over the last eleven days, XRP ETF inflows have added up to roughly $170.30 million. The streak has stayed consistent rather than choppy.
Month | Net Inflow |
August | $159.18M |
July | $27.29M |
June | $59.46M |
March | -$31.16M (outflow) |
Cumulative net inflow into the XRP ETF now sits around $1.68 billion. Total net assets are near $1.44 billion.
That's a meaningful signal that institutional demand hasn't dried up, even while the spot price slides.
Bitcoin price prediction: Is this a familiar pattern?
Not everyone reads this pullback as purely bad news.
Analyst Ali Charts pointed to similarities between Bitcoin's current price structure and its 2023 bottoming pattern.
Back then, Bitcoin tested resistance three separate times. Each attempt was followed by a roughly 20% pullback toward the middle of its trading range, before a fourth attempt finally broke out.
Bitcoin has already been rejected once near the top of a similar channel this time around.
If the pattern repeats, further failed breakout attempts and a pullback toward the $70,000 zone could come before any decisive move higher.
For now, the immediate driver remains geopolitical. Crypto markets are trading defensively until there's more clarity on how far the Iran conflict extends.
What does the BTC/USD chart show right now?
The BTC/USD 1-hour chart shows Bitcoin trading inside a descending channel. Price is currently near $77,576, sitting in the lower-middle part of that channel.
BTC bounced recently from the $76,400 to $76,800 zone. That suggests buyers are still defending that level.
The RSI reading near 48 points to neutral momentum, not strong buying or selling pressure.
Short-term moving averages are bunched around $77,600 to $77,900. That cluster is acting as resistance for now.
Base case: A modest bounce toward $78,000 to $78,400 is possible if BTC holds above $76,800 to $77,000. A move past $78,400 could open the door to $78,800 to $79,200.
Downside risk: Losing the $76,800 support could send Bitcoin back toward $76,400, with $76,000 as the next level to watch.
Ethereum price prediction: what do the charts say about ETH?
On the 4-hour chart, Ethereum is trading between roughly $2,380 and $2,420.
The price has slipped below both the 20 EMA (around $2,440) and the 50 EMA (around $2,429).
The RSI reading is close to 33, pointing to weak momentum. It isn't deeply oversold yet, but it's getting closer to that zone.
Zooming out, the 100 EMA sits near $2,342. The 200 EMA is close to $2,197 on the 4-hour chart.
Both are still trailing well below the current price. That tells us the broader uptrend from the August breakout hasn't actually broken down yet.
ETH has been repeatedly rejected near the $2,500 to $2,550 zone. That now looks like a solid resistance area on the chart.
A separate signal worth noting is the daily chart, where some analysts point to a golden crossover forming.
Historically, this pattern has sometimes lined up with the early stages of longer bull runs, though it doesn't guarantee that outcome every time.
What is the key support level for Ethereum?
The $2,380 zone is the level most traders are watching closely.
If that support breaks on a clean 4-hour close, ETH could slide toward $2,340, and possibly $2,300 to $2,200 after that.
Ethereum is also approaching its 50-week EMA. Holding above this longer-term average could open the door to a move back toward $2,500 to $2,550.
What happens if Ethereum holds $2,380 support?
If buyers step in and reclaim the $2,430 to $2,450 zone, a relief move toward $2,500 becomes more likely.
$2,550 marks the bigger breakout level from there. A sustained break above $2,550 could open the path toward the $2,700 to $2,800 range over time.
XRP price prediction: what does the chart show?
Here's where the technical setup gets interesting.
XRP price is compressing between rising support around $1.30 to $1.35 and a descending resistance trendline coming down from the $1.55 to $1.60 rejection zone in late August.
That's a classic tightening pattern. When support keeps rising and resistance keeps falling, a breakout in either direction tends to follow.
The daily chart also shows why traders are paying attention. XRP already pulled off a similar move in mid-August, jumping about 55.68% off the $1.00 support zone before topping out near $1.70.
The current setup looks like a smaller version of that same pattern.
XRP is trading above its 20-day and 50-day EMAs, currently near $1.31 and $1.22. It remains below the longer-term 100-day and 200-day EMAs, which are still sloping down from higher levels.
The daily RSI sits around 58, cooling off from a recent high near 72. That suggests the sharp momentum from late August has eased without turning outright bearish.
Bullish scenario: If XRP holds the $1.30 to $1.35 zone and breaks above the descending trendline, the first target sits around $1.55 to $1.70, with a further move toward $2.00 to $2.10 possible after that.
Bearish invalidation: A sustained break below roughly $1.30 would weaken this setup and could open the door to lower support levels.
The measured move on the chart points toward the $2.10 area, roughly 55% above the current $1.35 level. That's a target, not a guarantee. It depends heavily on whether XRP can defend its current support zone.
Disclaimer
This article is for informational purposes only and does not constitute financial, investment, or trading advice. Cryptocurrency markets are highly volatile and carry significant risk of loss. Past performance and chart patterns do not guarantee future results. Always do your own research and consult a licensed financial advisor before making investment decisions.


1 month ago
I invested in bitcoin trading After losing $78.4 USDT) linked to a romance fraud scam worth of cryptocurrency through an online investment platform and later discovered it was a scam. After extensive research for recovery options, I contacted CAPITAL CRYPTO RECOVER based on positive client reviews and recommendations. Their professional security team guided me through the recovery process using advanced technology, and I was able to recover my lost cryptocurrency successfully. I am truly grateful for their support and assistance during such a difficult experience. I will advise you to contact CAPITAL CRYPTO RECOVER helped me recover my funds. For anyone facing similar issues, Website: https://recovercapital.wixsite.com/capital-crypto-rec-1 Email: Capitalcryptorecover@zohomail.com Telegram: @Capitalcryptorecover Contact: Recoverycapital@fastservice.com WhatsApp/Text Number: +1 (336) 390-6684

1 month ago
I invested in bitcoin trading After losing $78.4 USDT) linked to a romance fraud scam worth of cryptocurrency through an online investment platform and later discovered it was a scam. After extensive research for recovery options, I contacted CAPITAL CRYPTO RECOVER based on positive client reviews and recommendations. Their professional security team guided me through the recovery process using advanced technology, and I was able to recover my lost cryptocurrency successfully. I am truly grateful for their support and assistance during such a difficult experience. I will advise you to contact CAPITAL CRYPTO RECOVER helped me recover my funds. For anyone facing similar issues, Website: https://recovercapital.wixsite.com/capital-crypto-rec-1 Email: Capitalcryptorecover@zohomail.com Telegram: @Capitalcryptorecover Contact: Recoverycapital@fastservice.com WhatsApp/Text Number: +1 (336) 390-6684
















