XDC Network Price Prediction: $XDC Rallies as Volumes Return


XDC just broke out and traders are watching closely.
The token is up nearly 8% today, breaking above a long downtrend line just as trading volumes show real signs of life again after a rough year.
This XDC Network Price Prediction checks whether this rebound has staying power.
Market data was checked on August 24, 2026, at 16:07 IST.
XDC Network Price Prediction Today: Market Overview
Metric | Value |
Price | $0.030944 |
24h Change | +8% |
Market Cap | $650.33M (+7.79%) |
FDV | $1.17B |
24h Volume | $8.72M (+59.27%) |
Vol/Mkt Cap (24h) | 1.33% |
Total Supply | 38.09B XDC |
Circulating Supply | 21.02B XDC |
Source: Data from CoinMarketCap as of August 24, 2026, at 16:07 IST. Figures may vary slightly across other tracking websites.
XDC trading volume: Report
BSCN reported that daily exchange volumes for $XDC, based on Artemis data, have collapsed since August 2025.
A year ago, volumes typically ran between $25M and $50M, peaking near $80M in October. 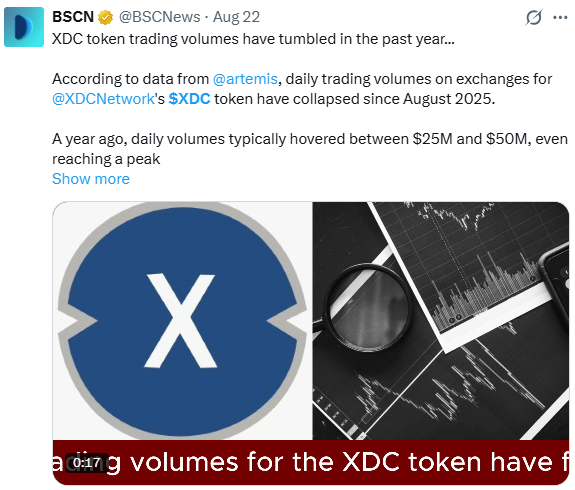
Source: Data From X
By early August 2026, daily volumes typically sat well below $10M. That said, the recent market resurgence has lifted $XDC volume too, with August 20 seeing more than $13M in activity, a sign demand may be returning.
$XDC Network Price Prediction Chart: Technical Analysis
Pair: XDC/USD · Market: Spot (Crypto) · Exchange: Aggregated (Crypto) · Timeframe: 1D · Source: TradingView · Timestamp: August 24, 2026, 16:07 UTC+5:30
$XDC broke above a descending trendline that had capped price since May, rallying to $0.030944, up 8% on the daily candle after hitting an intraday high of $0.030959.
The key is for the price to hold the current support level, which could help maintain momentum and drive further upside.
Both EMAs sit just below the spot, with EMA 20 at $0.028006 and EMA 50 at $0.027880, confirming the breakout is running just above its recent average.
RSI is reading 71.38, in overbought territory, suggesting some near-term cooling is possible even within a genuine trend shift.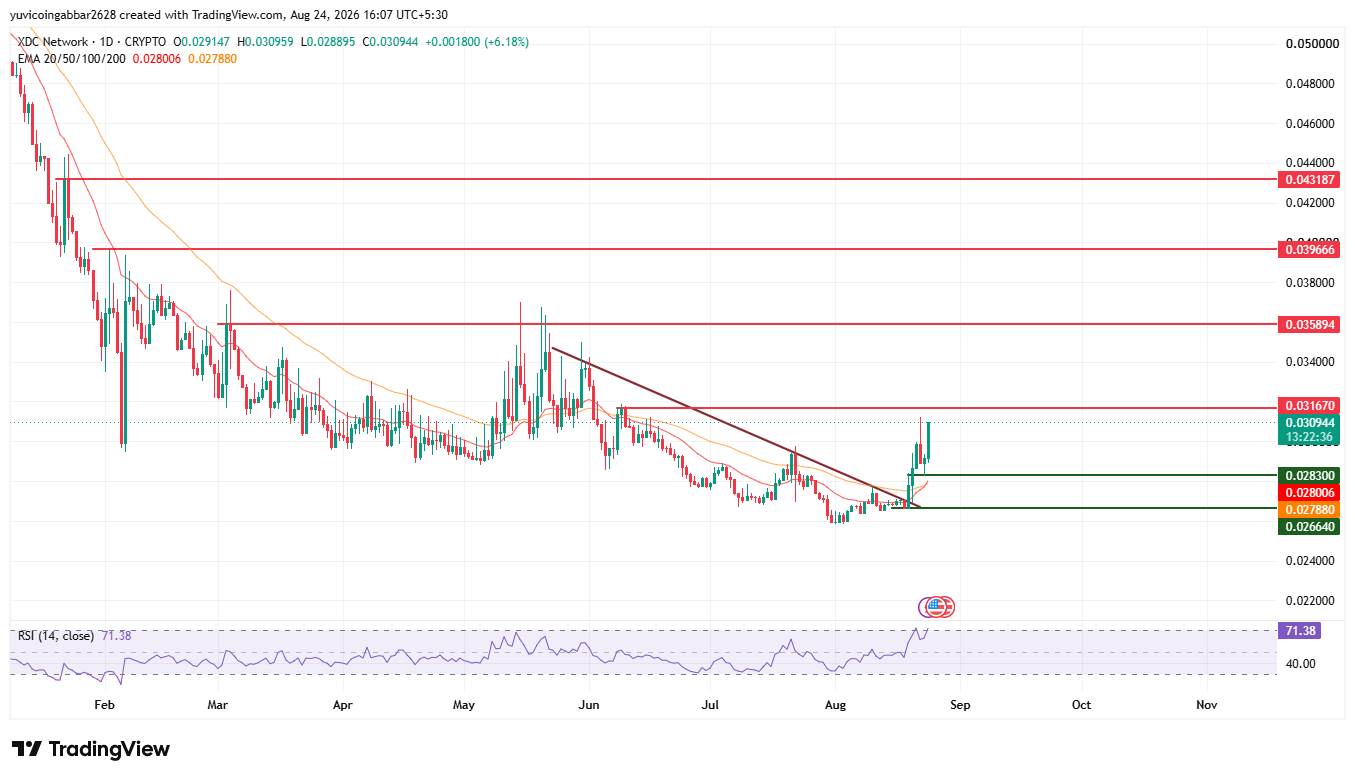
$XDC Network Price Prediction: Support and Resistance Levels
Level Type | Price |
Resistance 4 | $0.043187 |
Resistance 3 | $0.039666 |
Resistance 2 | $0.035894 |
Resistance 1 (nearest) | $0.031670 |
Immediate Price Reference | $0.030944 |
First Confirmed Support | $0.028300 |
Deeper Support | $0.026640 |
$XDC Network Forecast: Bull Case vs Bear Case
Bull case: Holding above $0.028300 keeps the trendline breakout intact. A close above $0.031670 opens the path toward $0.035894.
Bear case: An RSI above 71 leaves XDC exposed to a pullback. Losing $0.028300 would put the breakout in doubt, with $0.026640 as the next support.
$XDC Network Price Prediction: Expert View
According to CoinGabbar analysts, the breakout lines up with an actual improvement in trading activity rather than pure hype, which gives this move more credibility than a one-day spike.
Still, an RSI above 71 means the rally is stretched, so a cooldown toward $0.028300 wouldn't be surprising.
The $0.028300 to $0.031670 range is the zone to watch: holding it keeps the breakout thesis alive, while a clean break above $0.031670 opens room toward $0.035894 and beyond.
Disclaimer: This piece is for informational purposes only and isn't financial advice. The levels and scenarios above are based on technical chart analysis and publicly available data at the time of writing, and crypto markets can move sharply within hours, so past patterns don't guarantee future outcomes. It's worth doing independent research and considering your own risk tolerance before acting on any of the levels discussed here.
Also read:












.webp)




