Quant Price Prediction: Can QNT Reclaim the $206.13 Level?


Can QNT reclaim the $206.13 Level, or is another leg lower already forming?
This Quant price prediction begins with QNT trading under the price band it held earlier. Traders who followed the earlier Quant price view can compare it with the fresh levels below.
Quant Price Forecast: 24-Hour Snapshot
The CoinGecko market data shows Quant at $156.02, down 21.3% for the week. Price sits 8.3% above the 24-hour low and 1.8% under the high.
Metric | Value |
Price | $156.02 |
7-day change | -21.3% |
24h range | $144.16 to $158.97 |
Market cap | $2.27B |
Market cap rank | 39th |
FDV | $2.279B |
Circulating supply | 14.556M |
Total supply | 14.612M |
Source: CoinGecko, QNT market snapshot, captured Nov 16, 2026, 05:26 UTC
FDV, or fully diluted valuation, is the coin's value if every token were already in circulation. It reads $2.279B against a $2.27B market cap, so almost no supply is left to release.
QNT Whale Concentration: Top 100 Wallets Hold 74.62%
The Etherscan token holder data shows the top 100 wallets holding 74.62% of supply. The top 5 hold 47.12%, and the top 10 hold 52.70%.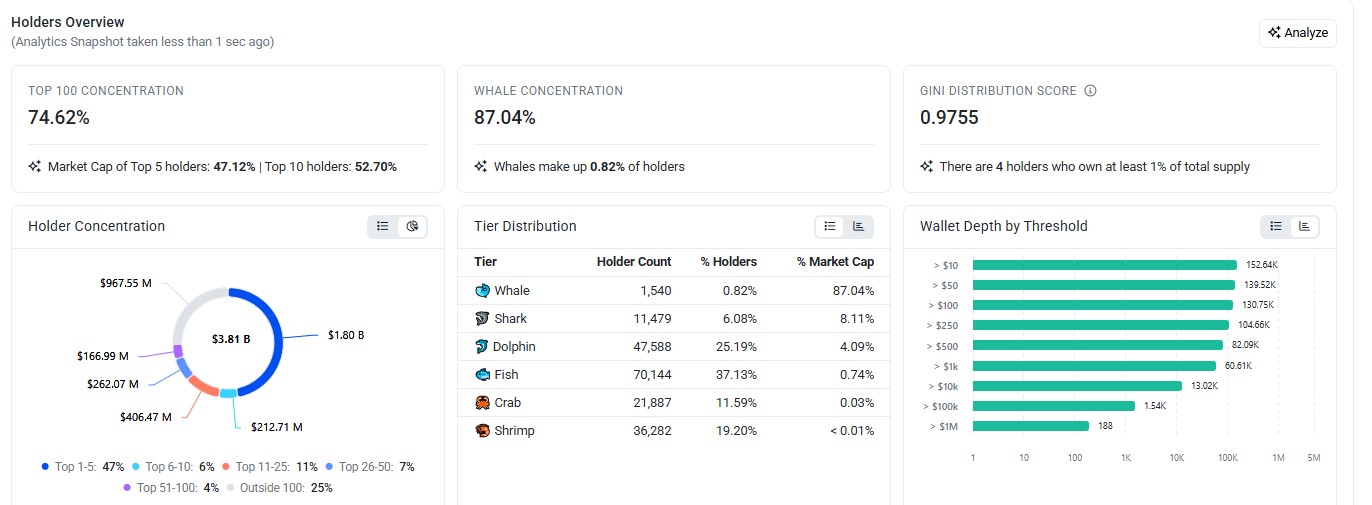
Source: Etherscan, QNT holder analytics overview, captured Nov 16, 2026, 05:26 UTC
Whales, meaning wallets with very large balances, hold 87.04% of market cap while making up 0.82% of holders. That QNT whale concentration means four holders own at least 1% of the supply each, so a few large orders can move the price fast.
Quant Open Interest and Futures Volume Data
Open interest is the total value of futures contracts still open, showing how much money traders keep riding on a coin. The CoinGlass futures data shows $155.55M in 24-hour futures volume and $58.12M in open interest.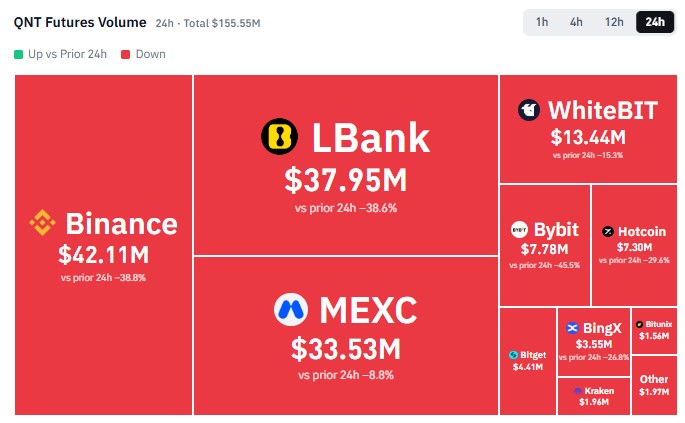
Source: CoinGlass, $QNT futures volume heatmap, 24h, captured Nov 16, 2026, 05:26 UTC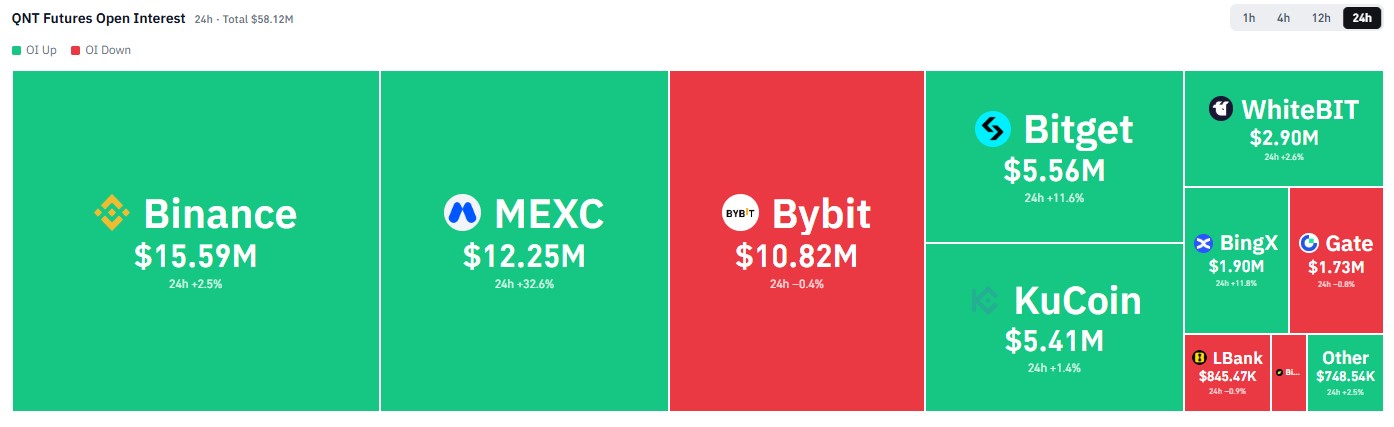
Source: CoinGlass, $QNT futures open interest heatmap, 24h, captured Nov 16, 2026, 05:26 UTC
Futures volume ran below the prior 24 hours on every exchange that prints a change. MEXC open interest still jumped 32.6% while its volume dropped 8.8%, so why are traders opening new positions after a weekly slide?
Rising open interest after a drop means traders are adding positions, and that can fuel sharp moves in either direction.
Quant Technical Analysis: 4-hour Timeframe
The Binance 4-hour chart for $QNT/USDT on TradingView frames this Quant price prediction. A November drop pushed QNT toward $141.52 before buyers took control.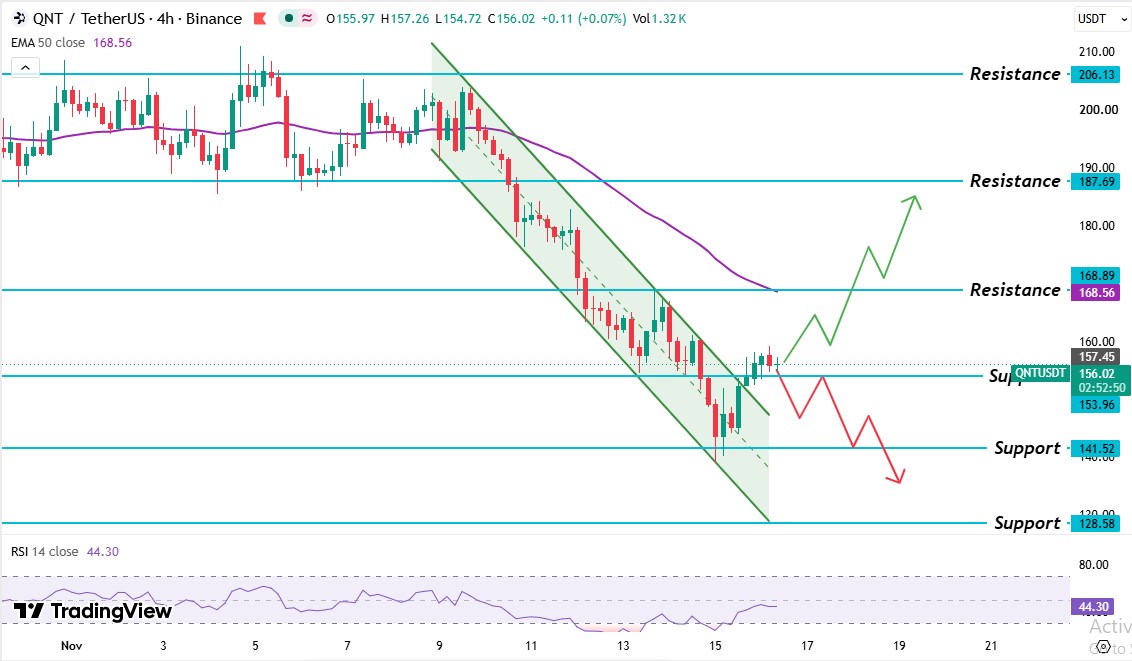
Source: TradingView, QNT/USDT 4H chart with EMA 50 and RSI 14, captured Nov 16, 2026, 05:26 UTC
Earlier, $QNT traded in a range, a band held between a $187.69 support level and a $206.13 resistance level. A support level is where buyers have stepped in before, and a resistance level is where sellers have.
Then the $187.69 support level broke and flipped into a resistance level, since buyers stuck at a loss tend to sell when price returns there. Price slid inside a falling channel, two downward-sloping lines that guide a drop.
A first bounce stalled at the $168.89 resistance level. The $153.96 support level broke next, and the price wicked toward the $141.52 support level before buyers stepped in. That bounce pushed $QNT through the channel's upper line, an early bullish sign.
Right now, $QNT trades above the $153.96 support level, below the $168.89 resistance level, and under the 50 EMA, an exponential moving average of recent prices. The QNT triangle support test covers an earlier setup for comparison.
The QNT 50 EMA sits at $168.56. $QNT's $156.02 price trades 7.4% below it. The latest 4H candle trades under it too, and the $168.89 resistance level sits beside it, so a recovery needs a candle trading above both.
The QNT RSI reads 44.30 on the 14-period setting. It sank toward 30 during the slide. Under 50 means sellers hold the edge. Above 30 means oversold conditions, where selling has gone too far and hasn't formed, so the price has room to fall.
Quant Support and Resistance Levels
Level | Type |
$206.13 | Resistance level |
$187.69 | Resistance level |
$168.89 | Resistance level |
$168.56 | 50 EMA |
$153.96 | Support level |
$141.52 | Support level |
$128.58 | Support level |
These support levels and resistance levels come from the chart. The nearest are $153.96 below and $168.89 above, with the 50 EMA at $0.33 under the upper one.
Quant Price Forecast: Bull, Base, and Bear Scenarios
Scenario | Trigger | Target | Invalidation |
Bull | Daily candle above the $168.89 level | $187.69, then $206.13 | Falls back below $168.89 |
Base | Price stays between $153.96 and $168.89. | Sideways trade in that range | Daily candle breaks either level. |
Bear | Daily candle below $153.96 | $141.52 | Daily candle above $168.89 |
Risks to this Quant price prediction: a price slide back inside the channel would erase the breakout. And a whale sale, with the top 100 wallets holding 74.62% of supply, could pull the price toward $141.52.
Expert Outlook: Quant Price Prediction
As per CoinGabbar analysis, this Quant price prediction stays bearish, while the 50 EMA at $168.56 caps the bounce. The RSI at 44.30 says sellers hold the edge.
The first read says sellers are in control. On a second pass, the channel breakout and rising open interest at MEXC suggest buyers are testing that view.
A daily candle trading above $168.89 would show the breakout has follow-through. One trading below the $153.96 level would hand control back to sellers.
Disclaimer: This article is for information only and isn't financial advice. Traders should do their own research and risk only what they can afford to lose.