How Far Could the RTX Price Shift After the Remittix Presale?

Remittix Presale Hits 91.31% Sold as Launch Nears
The Remittix Presale dashboard now shows RTX at $0.28 in the final stage, with the confirmed launch date of November 24, 2026 less than two weeks away.
This Remittix price prediction takes a different route from a plain target list. It measures how fast the dashboard’s own ladder rises and uses that slope as a yardstick for trading ranges.
Latest dashboard readings:
Share sold this stage: 91.31%
Amount collected: $33,374,617.68 of $36,000,000
Remaining to target: $2,625,382.32, or 7.3%
Final-stage figure: $0.46
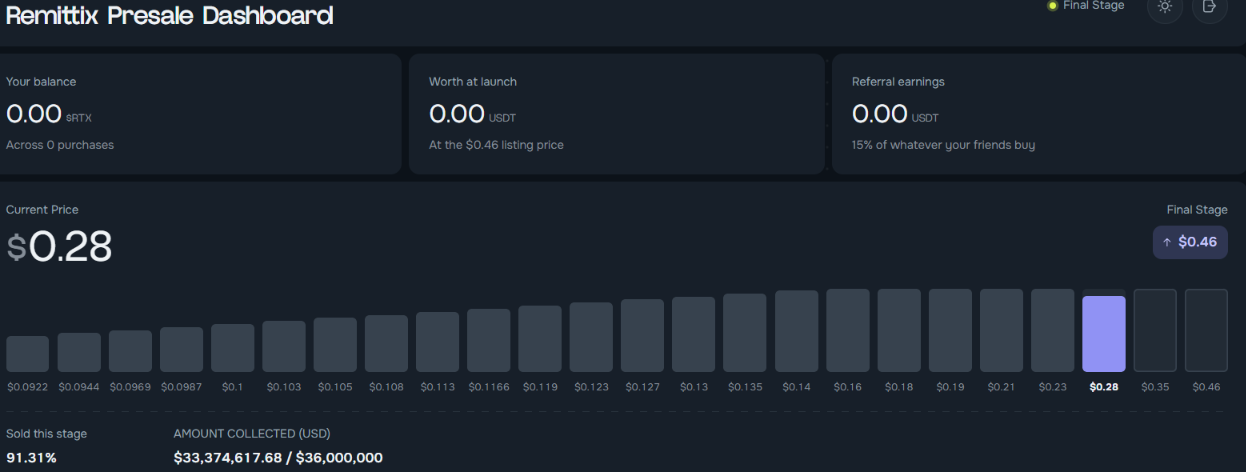
Source: Official Dashboard
Ladder Rungs: How Each Gain Grew Faster Than the Last
The Remittix Presale ladder has 24 rungs, from $0.0922 to $0.46. Grouping them into three phases shows that the gain per rung has accelerated sharply toward the end.
Phase | Rungs | Level Range | Average Gain per Rung |
Opening | 1 to 12 | $0.0922 to $0.123 | +2.7% |
Middle | 12 to 20 | $0.123 to $0.21 | +6.9% |
Closing | 20 to 24 | $0.21 to $0.46 | +21.7% |
Reading the Slope: What a 21.7% Move Means After Launch
The closing phase rose at roughly 21.7% per rung, so that figure works as a measuring unit for early trading. One jump of that size up from the final-stage figure is about $0.56, and one jump down is about $0.38.
The same measure shows where today’s Remittix Presale buyers stand. The $0.28 level sits about 2.5 jumps below the final-stage figure, which is the distance a fall would need to cover before they reach breakeven.
Any Remittix price prediction built this way assumes the market keeps moving in similar jumps. That is an assumption, not a pattern that open trading is bound to follow.
Slope Map: Three Jumps Up and Down From the $0.46 Mark
Jumps From Reference | Level | Change vs $0.46 |
+3 | $0.83 | +80.1% |
+2 | $0.68 | +48.0% |
+1 | $0.56 | +21.7% |
0 | $0.46 | Reference |
-1 | $0.38 | -17.8% |
-2 | $0.31 | -32.4% |
-3 | $0.26 | -44.5% |
Gains compound faster than losses in this layout. Three moves up add about 80%, while three moves down remove about 45%. That lean describes arithmetic, not a forecast of direction.
Scenarios: Where Trading Could Settle in the First Week
Base, $0.38 to $0.56 (one unit either side of the reference): demand and sell-offs balance near the dashboard figure.
Bullish, $0.56 to $0.68 (one to two units up): strong volume and a steady crypto market carry RTX higher.
Bearish, $0.26 to $0.38 (one to three units down): early sell-offs push RTX toward the final-stage cost.
These ranges are estimates, not certainties. The Remittix Presale ladder holds no data on trading behavior, so any range can be breached within hours of the first trades.
The outer ranges need a clear catalyst, such as heavy volume or a sharp drop in broader crypto market sentiment.
Risk Checks: Where the Slope Method Can Fail
Unit size: open trading does not follow fixed dashboard levels, so 21.7% can prove too large or too small.
Thin order books: day-one liquidity can widen swings in either direction.
Early sellers: the largest paper gains sit with the earliest buyers, who may sell first.
Market backdrop: weak sentiment across the crypto market could cap a rally.
Each risk applies from day one, so the opening sessions will show whether the dashboard’s jumps carry any information about open-market behavior.
If they do not, the Remittix Presale ladder should be treated as a pricing schedule only, not a model of trading.
Outlook: Levels and Dates for December 2026 and Early 2027
Nov 24: trading begins, with the final-stage figure as the main pivot
$0.38 and $0.56: one unit below and above the reference
$0.31 and $0.68: two units below and above, the outer edges of the December band
A hold above the reference through week one would favor the base and bullish ranges, while a close below $0.38 would point toward the bearish range.
For December 2026, a band of $0.31 to $0.68 reflects the uncertainty around new trading, and a move toward $0.83 in early 2027 would need steady volume and visible crypto payments adoption.
YMYL Disclaimer: This article is for informational and educational purposes only and should not be taken as financial or investment advice. Crypto markets are volatile, and the price scenarios here are estimates, not guarantees. Readers should do their own research before making any decisions.