RENDER Price Prediction: Can the $1.325 Support Hold This Week?

Can RENDER hold above $1.325, or does a slide toward $1.176 come next?
This RENDER price prediction begins with RENDER trading under its broken October range, the price band it held before sellers took over. The RNP-024 vote news is covered separately, so this piece stays on chart and market data. Price has slid for weeks.
RENDER Price Forecast: 24-Hour Market Snapshot
CoinGecko market data ranks RENDER at 77th with a $763.214M market cap. FDV, or fully diluted valuation, values all tokens as if they already circulate, and it reads $771.55M.
Metric | Value |
Price | $1.37 |
7-day change | -14.7% |
24h range | $1.36 to $1.42 |
Market cap | $763.214M |
Market cap rank | 77th |
FDV | $771.55M |
24h volume | $23.217M |
Circulating supply | 556.476M RENDER |
Total supply | 562.554M RENDER |
Max supply | 644.169M RENDER |
Source: CoinGecko, RENDER market snapshot, captured Nov 16, 2026, 09:48 UTC
Seven days, down 14.7%. And the 24h range spans only $1.36 to $1.42, so selling has slowed without buyers taking over.
RENDER Whale Wallets: Top 10 Holders Control 93.96%
Etherscan holder data shows extreme holder concentration, with the top 100 holders controlling 96.16% of supply and the top 10 holding 93.96%. A Gini score of 0.9957 backs that up, since a score near 1 means very few wallets own almost everything.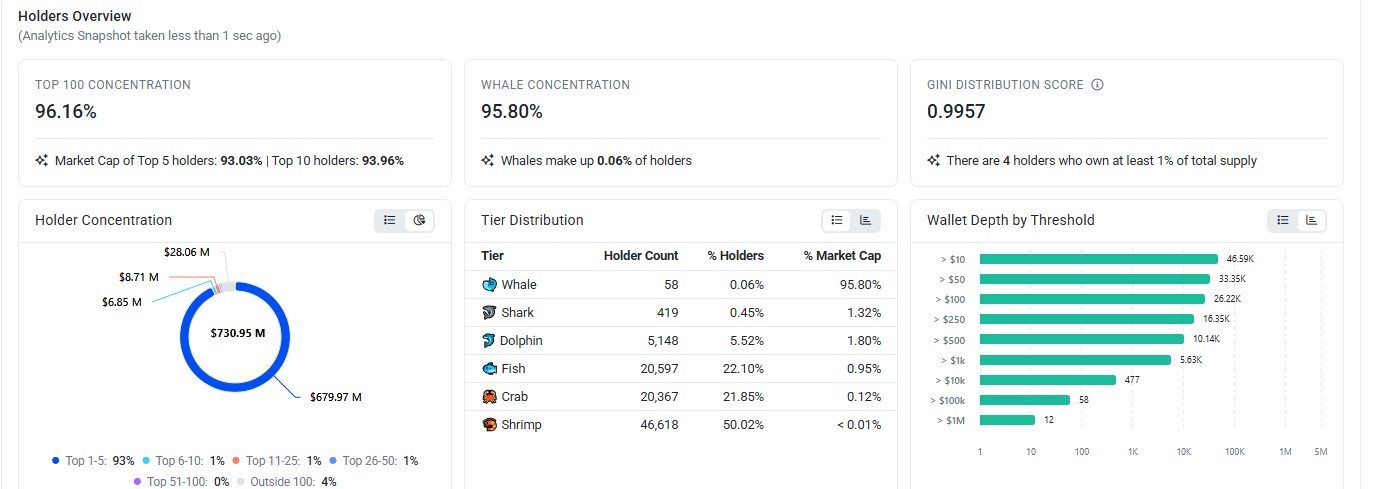
Source: Etherscan, RENDER holders overview, captured Nov 16, 2026, 09:48 UTC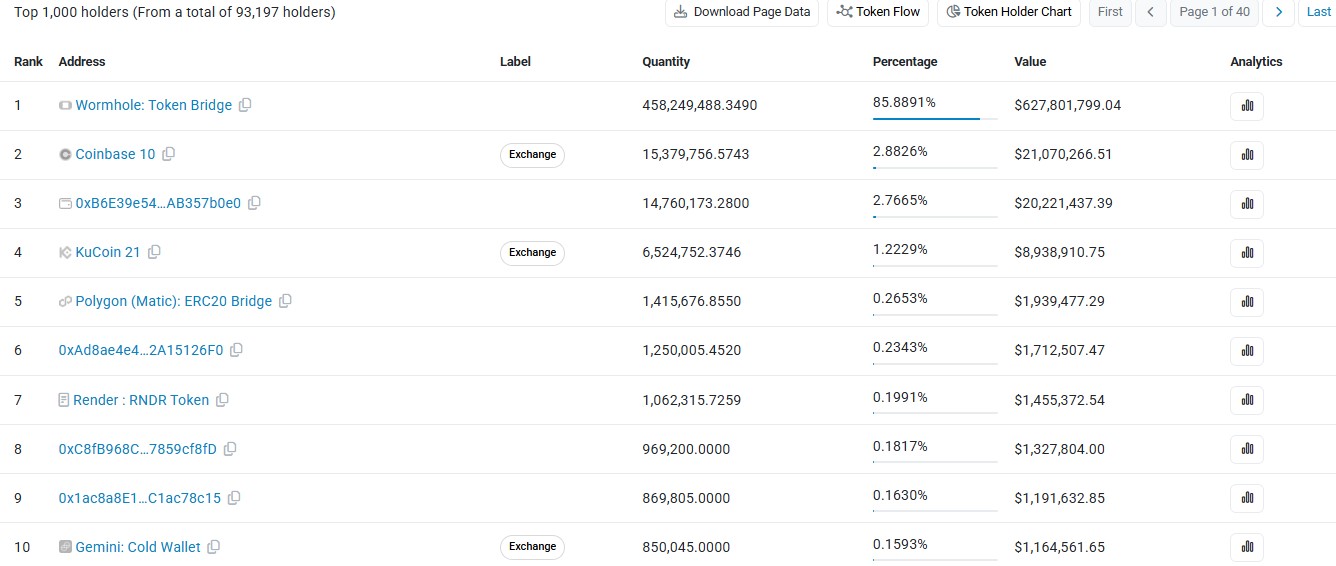
Source: Etherscan, RENDER top holders list, captured Nov 16, 2026, 09:48 UTC
Only 58 whale wallets, the top holder tier, own 95.80% of the market cap.
The largest address is the Wormhole token bridge at 85.8891%. But a bridge address holds tokens parked for another network, so that share isn't one trader's bet. Coinbase 10 holds 2.8826%, and KuCoin 21 holds 1.2229%, both labeled exchange wallets.
Concentrated supply means one large transfer can move thin order books. That adds risk to any RENDER price prediction.
RENDER Open Interest: $39.56M in Open Futures Positions
Open interest is the total value of futures contracts still open. CoinGlass data puts RENDER open interest at $39.56M, with 24h futures volume at $38.28M.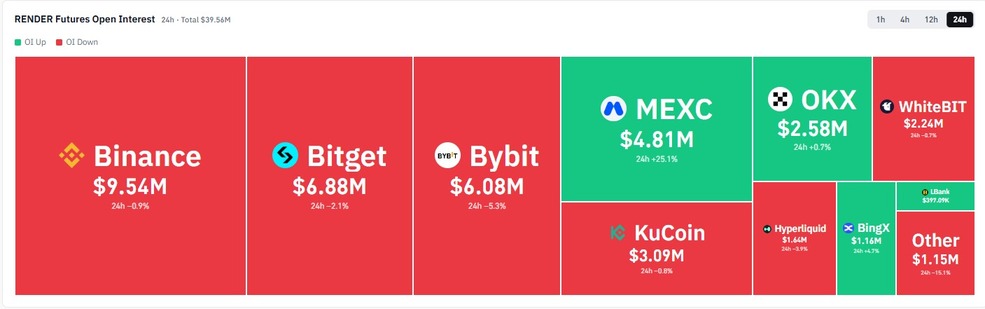
Source: CoinGlass, RENDER futures open interest, 24h data captured Nov 16, 2026, 09:48 UTC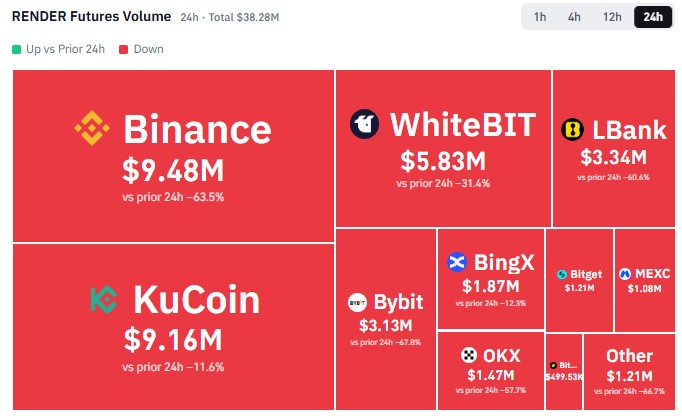
Source: CoinGlass, RENDER futures volume, 24h data captured Nov 16, 2026, 09:48 UTC
Open interest fell on most exchanges as price dropped, so traders are cutting positions instead of adding them. Thin trading can exaggerate a break below the $1.325 support level.
RENDER Technical Analysis: 1 Day Timeframe
The OKX 1D chart for RENDER/USDT on TradingView frames this RENDER price prediction. A September rally pushed RENDER up to $2.183 level before sellers took control.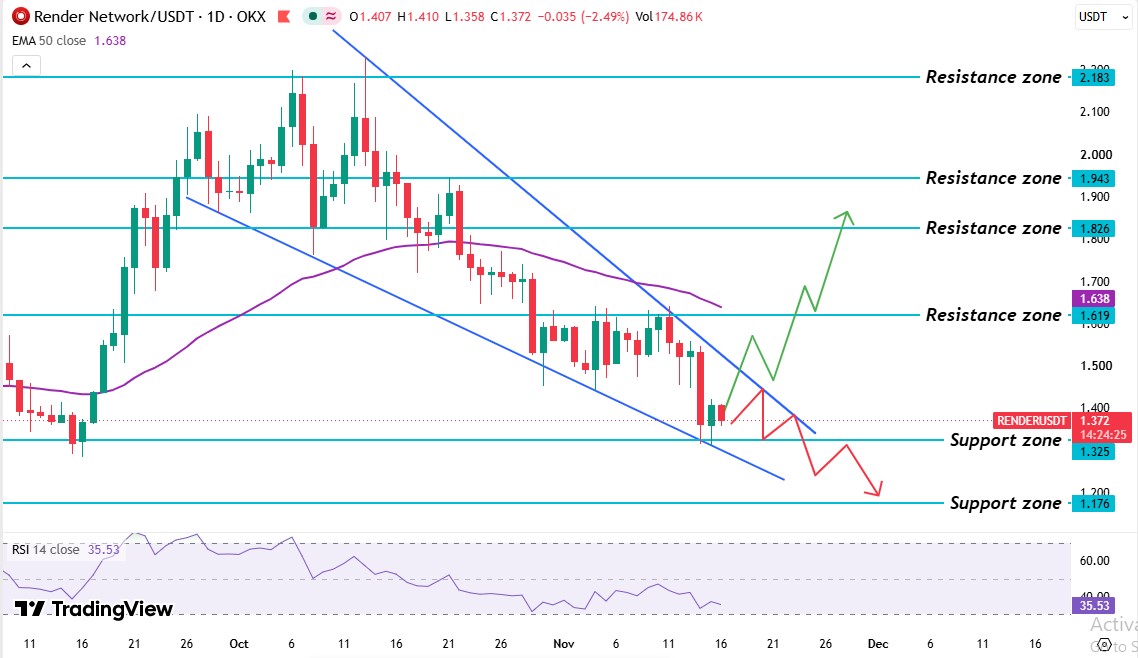
Source: TradingView, RENDER/USDT 1D chart with EMA 50 and RSI 14, captured Nov 16, 2026, 09:48 UTC
Buyers defended the $1.325 support level in mid-September, and the rally then stalled at the $2.183 resistance level. The price broke under $1.826 in late October, so that level flipped from a support level into a resistance level. Early November brought several failed attempts to trade above $1.619.
A red candle pushed RENDER into the $1.325 support level, which sits on the lower line of the falling wedge pattern. A falling wedge is two downward-sloping lines that squeeze together and often read as fading selling pressure. A break above the upper line points to a reversal, and a break below the lower line voids it.
Right now, RENDER sits just above the $1.325 support level and below the $1.619 resistance level. The 50-day EMA sits at $1.638, and the $1.37 price trades 16.4% below it. The latest daily candle trades below it too, so a real recovery needs a daily candle trading above both $1.619 and the EMA level.
The RENDER RSI reads 35.53 on the 14-day setting.relative strength index, scores momentum from 0 to 100. Under 50 means sellers hold the edge, and above 30 means the price has room to fall.
RENDER Support Levels and Resistance Levels
Level | Type |
$2.183 | Resistance level |
$1.943 | Resistance level |
$1.826 | Resistance level |
$1.638 | 50-day EMA |
$1.619 | Resistance level |
$1.325 | Support level |
$1.176 | Support level |
The nearest levels are $1.325 below and $1.619 above.
RENDER Price Forecast: Bull, Base, and Bear Scenarios
Scenario | Trigger | Target | Invalidation |
Bull | Daily candle trades above $1.619 | $1.826, then $1.943 | Falls back below $1.619 |
Base | Price stays between $1.325 and $1.619. | Sideways trade in that range | Daily candle breaks either level. |
Bear | Daily candle trades below $1.325 | $1.176 | Daily candle trades above $1.619 |
A regulatory delay or a bad headline could cut demand fast. For this RENDER price prediction, technical invalidation is simpler to track, since a daily candle trading below $1.325 exposes $1.176.
RENDER Price Prediction: Expert Outlook
According to CoinGabbar analysis, the base case holds, with a bearish tilt until a daily candle trades above $1.619. RENDER sits 16.4% below the 50-day EMA, and the RSI reads 35.53. Open interest also fell on most exchanges, so sellers still hold the edge.
Traders should track the daily candle at $1.325, because a trade below it ends the bounce case and exposes $1.176.
Disclaimer: This article is for information only and isn't financial advice. Traders should do their own research and risk only what they can afford to lose.