Solana Latest Update: 14.2B Transactions, 1.2M Holders, SOL Price Up?

Network Activity and Tokenized Stocks Both Hit Records
Network usage and on-chain stock adoption have both reached new highs, and together they define the Solana latest update this week. The network's official X account reported that tokenized equities on the chain hit an all-time high of 1.2 million holders, alongside a record quarterly transaction count.
Both point to growing use of the chain, from trading to asset ownership. For readers scanning crypto news today, usage data and price are moving in the same direction for now.
Record 14.2 Billion Non-Vote Transactions Mark a 45% Quarterly Jump
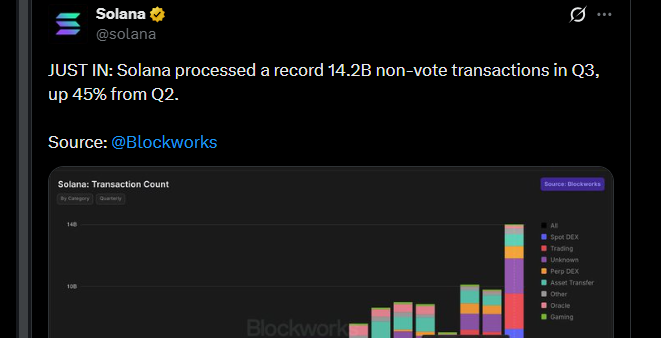
The network processed a record 14.2 billion non-vote transactions in the third quarter, up 45% from the second.
Non-vote transactions exclude validator voting messages, so they reflect user and application activity. In this Solana latest update, the quarter's bar is the tallest on a chart that reaches back to 2022.
Third-quarter total: about 14.2 billion.
Growth: up 45% quarter over quarter.
Implied second-quarter level: roughly 9.8 billion, by simple division.
Spot DEX Trading Drives About Half of the Activity
Category | Q3 transactions (approx.) |
Spot DEX | 7.1B |
Trading | 2.4B |
Unknown | 2.4B |
Perp DEX | 0.8B |
Asset transfer | 0.8B |
Other, oracle, and gaming | 0.7B |
Spot DEX alone makes up roughly 50% of the total. This Solana latest update therefore says more about trading demand than about payments, since asset transfers sit near 0.8 billion. The figures are rounded from the chart's quarterly breakdown.
Source: Official X Post
Tokenized Equities Reach 1.2 Million Holders
Holders of tokenized equities hit an all-time high of 1.2 million, with 775,000 joining in September alone. That means about 65% of the entire base arrived in one month.
Trend: the chart shows a slow climb for most of the year, then a steep rise in September.
Measurement: the metric counts unique addresses with a non-zero balance, not unique people, so one user spreading funds across several wallets can inflate the count.
Context: September's 775,000 new holders outnumber the roughly 425,000 who held tokenized equities before the month began.
Source: X Post
Solana Price Today: SOL Near $119 After an 18.71% Monthly Gain
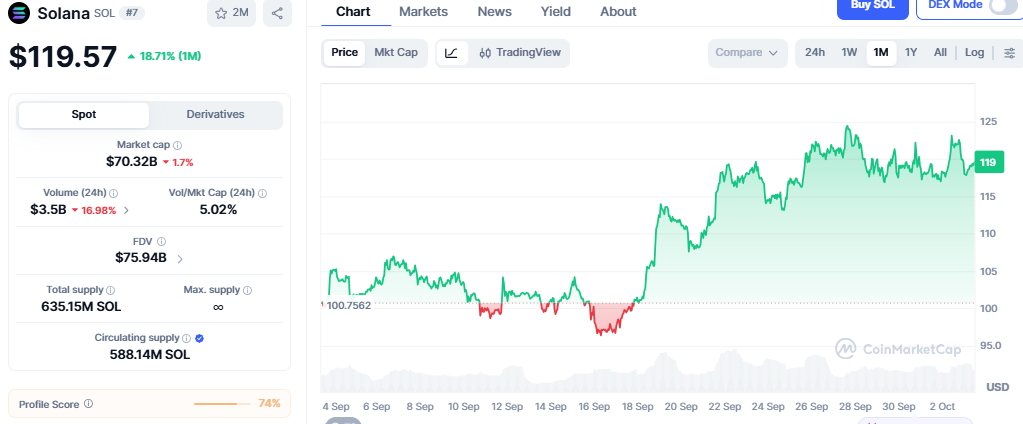
SOL started September near $100.76, slipped below $100 in mid-month, then rallied to a high near $125 in late September. The price now sits slightly under that peak, roughly $19 above where the month began, and the latest day was quieter on volume.
Metric | Reading |
|---|---|
Price | $119.57 |
1-month change | +18.71% |
Market cap | $70.32B (down 1.7%) |
24-hour volume | $3.5B (down 16.98%) |
Volume to market cap | 5.02% |
Rank | #7 |
Circulating supply | 588.14M SOL |
Source: CoinMarketCap Chart
Note: Prices can change quickly, so figures may not reflect the latest value. Readers should check a live price tracker for current data.
Do Record Activity Numbers Mean Higher Prices?
Not automatically, so the careful reading of this Solana latest update is that activity and price rose together, not that one caused the other. Transaction counts measure usage, not value, and one record rarely moves a price alone.
Because spot trading is half of all activity, part of the surge may simply reflect a strong month for traders.
Supported by the data: usage grew 45% in a quarter, and tokenized equity holders reached a record.
Not shown: a direct link between those records and the monthly price gain.
What to Watch Next After the Solana Latest Update
Whether fourth-quarter transactions stay above 14 billion.
Whether tokenized equity holders keep growing after September's surge.
Whether SOL holds above $119 and revisits the late-September high.
Whether asset transfers and other non-trading categories gain share.
Whether market cap, now $70.32B, recovers its 1.7% daily dip.
The pattern is clear: record usage, a surge in tokenized stock holders and a strong monthly price. What remains open is whether activity beyond trading keeps growing. Treat this Solana latest update as a snapshot, not a forecast.
YMYL Disclaimer: This article is for information only and is not financial or investment advice. Crypto prices, including SOL, are volatile, and the figures here are a snapshot, not a forecast. Do your own research and consult a qualified financial professional before making any decision.






