Sui Price Prediction: Can Bullish Divergence Send $SUI to $20?

Sui is heating up again. SUI is trading at $0.7800, up 7.55% in the last 24 hours, and social media is split between two very different calls.
One account is hyping a run to $20 before an upcoming event, while a well-known trader is pointing to a bullish divergence on the chart instead.
This Sui Price Prediction looks at both claims, plus the actual support and resistance levels shaping where SUI goes next.
Crypto News Today: SUI Liquidations Point to a Short Squeeze
Window | Total Liquidated | Long | Short |
1h | $1.12K | $728.57 | $387.06 |
4h | $372.41K | $9.87K | $362.54K |
12h | $926.61K | $39.26K | $887.35K |
24h | $1.10M | $91.26K | $1.01M |
Shorts make up over 92% of the 24h liquidations Coinglass data, meaning traders betting against SUI are getting forced to buy back as price rises, which itself adds to the move.
$SUI News: Trader Flags a Bullish Divergence on SUI
SUI continues building a bullish divergence, calling it "great," with his chart marking a "mean reversion play" that should indicate further continuation and a potential resistance zone just above the current price.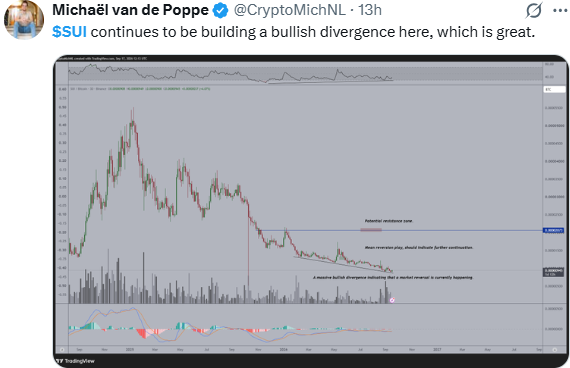
Source: Data From X
This is his stated technical view, not confirmed data, and CoinGabbar could not independently verify how the divergence plays out from here.
Sui News Today: Social Media $SUI Target
A post from account Sui Intern (suintern) told followers to send SUI now, calling for a move to $20 "before basecamp," with no supporting data or timeline given.
Source: Data From suiintern on X
This is an unverified, hype-driven social media claim rather than analysis, and CoinGabbar could not confirm any basis for a $20 target. It's worth treating as speculation rather than a forecast.
SUI Technical Analysis
SUI is trading at $0.7800, up 5.21% on the current candle. Since the start of September, the price has been moving inside a tightening channel, bounded by two converging trendlines that squeeze the range narrower with each candle. 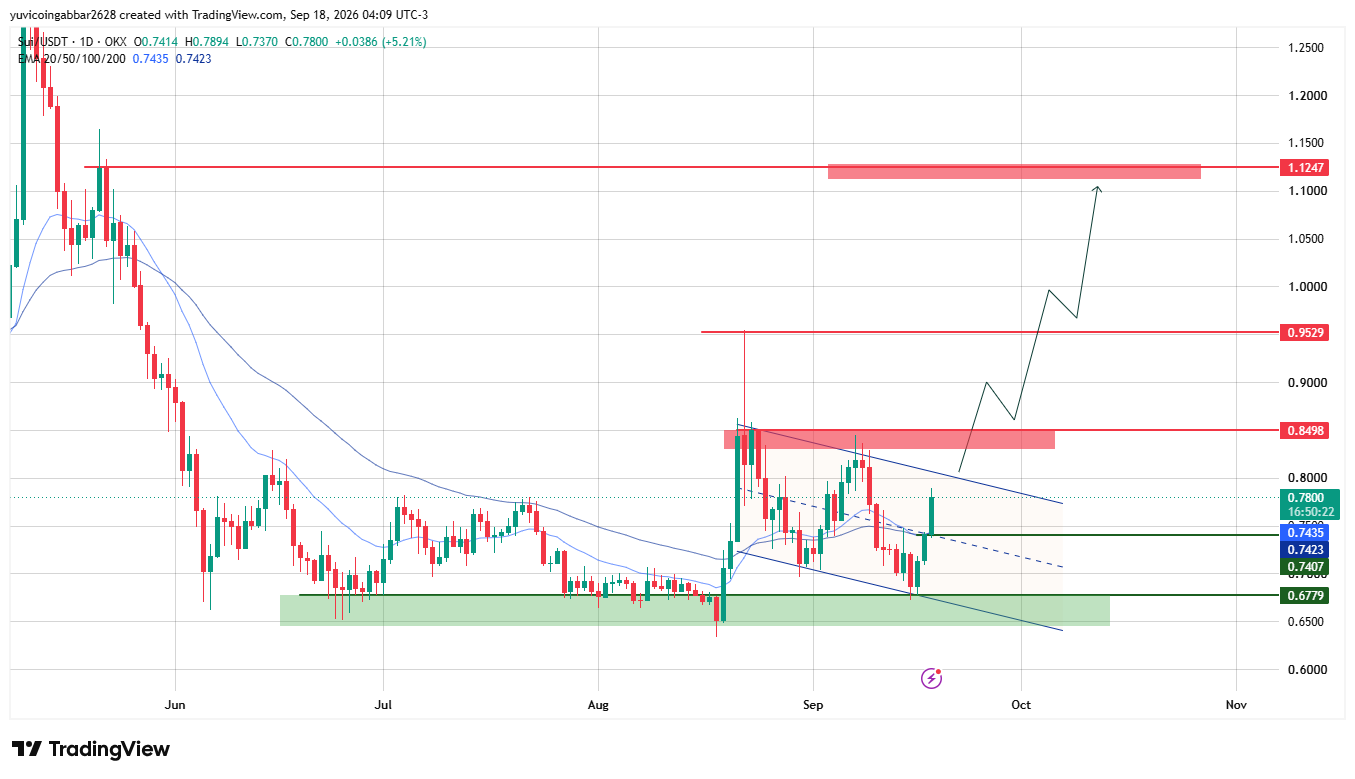
This kind of channel usually means the market is coiling before a bigger move, rather than trending cleanly in one direction.
Right now, SUI is trading near the upper edge of that channel, right on top of the EMA cluster, which has flipped from acting as resistance into acting as support after the recent bounce off the $0.6779 zone.
Staying inside the channel for now means the price is still consolidating, but a clean close above the upper trendline and the $0.8498 resistance zone would count as a confirmed healthy breakout of this channel, opening the door toward $0.9529 and, further out, the $1.1247 zone.
If instead SUI slips back below the EMA cluster and the lower trendline, it would suggest the channel is resolving downward, putting the $0.6779 support zone back in play.
SUI IMP Key Levels
Level Type | Price |
Resistance 3 | $1.1247 |
Resistance 2 | $0.9529 |
Resistance 1 (nearest) | $0.8498 |
Immediate Price Reference | $0.7800 |
Support | $0.6779 |
Sui Price Prediction: What Can Happen Next?
Bull case: Holding above the EMA cluster near $0.7423 to $0.7435 while clearing the nearest resistance at $0.8498 keeps the path open toward $0.9529, and eventually the $1.1247 zone.
Bear case: A close back below the EMA cluster at $0.7423 would put the recent bounce in question and risk a slide back toward the $0.6779 support zone.
Sui Price Prediction: Can Sui Reach $1.1247?
It's the highest level marked on this chart, so yes, in theory, but it would take a multi-stage move rather than a single leg. SUI would first need to clear $0.8498, then $0.9529, before the $1.1247 zone comes into play.
Sui Price Prediction 2026: Expert View
According to CoinGabbar analysts, The heavy short liquidations and the EMA reclaim both point to short-term bullish momentum, and the bullish divergence flagged on social media lines up with that picture.
The $20 target, on the other hand, isn't backed by anything visible on the chart right now. $0.8498 is the real near-term test of whether this bounce has legs.
Disclaimer
This article is for informational purposes only and isn't financial advice. Crypto markets are highly volatile, and SUI prices can change quickly. The analysis and price levels discussed are based on market data and technical patterns and are not guaranteed. Always do your own research and consider your risk tolerance before making any trading or investment decisions involving SUI.


















