Venice Token Price Prediction: Poloniex, HTX Listings Change VVV?


After the exchange listings, the resistance level at $23.615 will decide whether buyers or sellers lead the next move.
This Venice Token price prediction begins with VVV trading well below its earlier highs. Coverage of VVV AI model launches adds background.
24-Hour Market Data Snapshot
This Venice Token price prediction uses CoinMarketCap data, which shows VVV at $21.74, up 5.8% over 24h. That ranks Venice Token 52nd by market cap.
Market cap sits at $1.07B. FDV is $1.76B because about 39% of supply isn't circulating yet.
Is $72.55M in 24-hour volume thin for this size? It seemed so at first. Maybe not, at 6.8% of market cap.
Do the Poloniex and HTX Listings Change the VVV News Backdrop?
An exchange listing means a trading platform opens a coin for deposits and trading. Per the official Poloniex X post, VVV deposits opened first, and full trading followed ninety minutes later.
HTX also announced a VVV listing in its official X post, with deposits open and trading due soon. Both posts are under a day old.
Source: Poloniex official and HTX official X post of the VVV listing, captured Nov 21, 2026, 09:58 UTC
Price is up 5.8% over 24 hours, a window that includes the listings. The chart shows a spike wick rejected at the resistance level at $23.615 before the posts. If volume follows, more VVV news from the crypto news feed could keep buyers focused there. If it doesn't, the support level at $19.608 matters more.
Does VVV Holder Concentration Raise the Risk Near Support?
Basescan holder data shows the top 100 wallets hold 97.50% of $VVV. That's extreme holder concentration.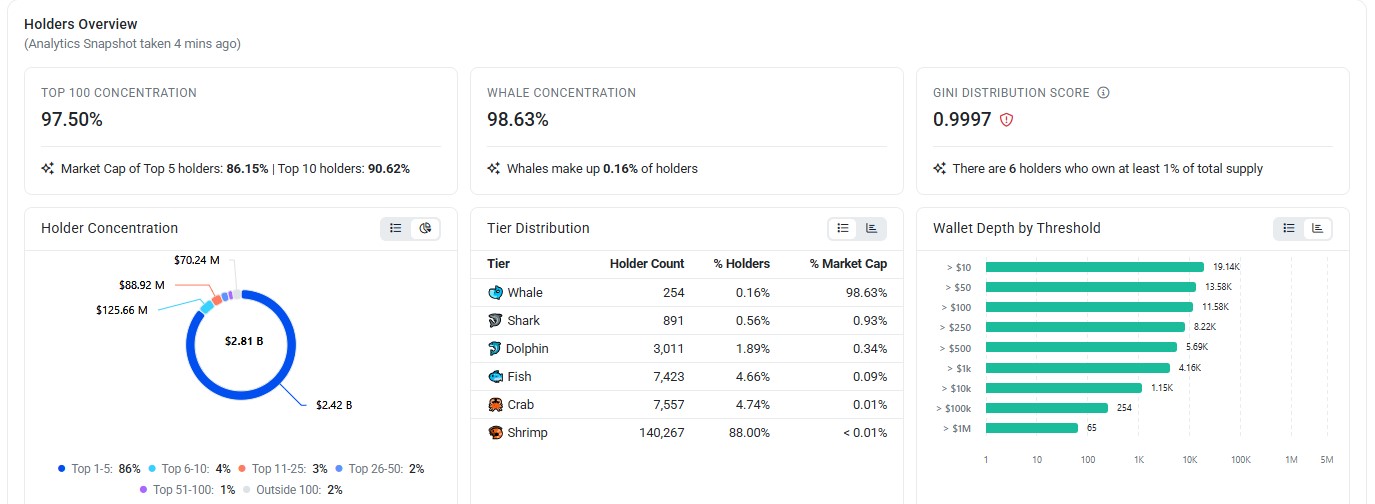
Source: Basescan holder analytics for $VVV, captured Nov 21, 2026, 09:58 UTC
The top 5 wallets hold 86.15%, and the top 10 hold 90.62%. Whales, the largest wallets, number 254.
The Gini score, a 0 to 1 measure of how unevenly tokens are spread, reads 0.9997. The tracker's chart totals $2.81B.
With supply this concentrated, one large transfer to an exchange could add sell pressure near the support level at $19.608.
Liquidation Data of Venice Token
CoinGlass liquidation data shows $610.95K liquidated over 24h.
Window | Longs | Shorts | Total |
1h | $14.26 | $0.00 | $14.26 |
4h | $1.87K | $19.94K | $21.82K |
12h | $149.99K | $39.89K | $189.88K |
24h | $554.91K | $56.04K | $610.95K |
Source: CoinGlass $VVV liquidation data, captured Nov 21, 2026, 09:58 UTC.
Longs took the hit over 24 h and 12 h. The last 4h flipped, with shorts losing $19.94K against $1.87K for longs.
Long liquidations add forced sell orders, and short liquidations add forced buy orders. Sellers dominated 24 hours, but forced buyers led the latest 4 hours.
Venice Token Price Prediction: Descending Channel Breakout
The TradingView $VVV/USDT 1D chart on Bybit frames this Venice Token price prediction.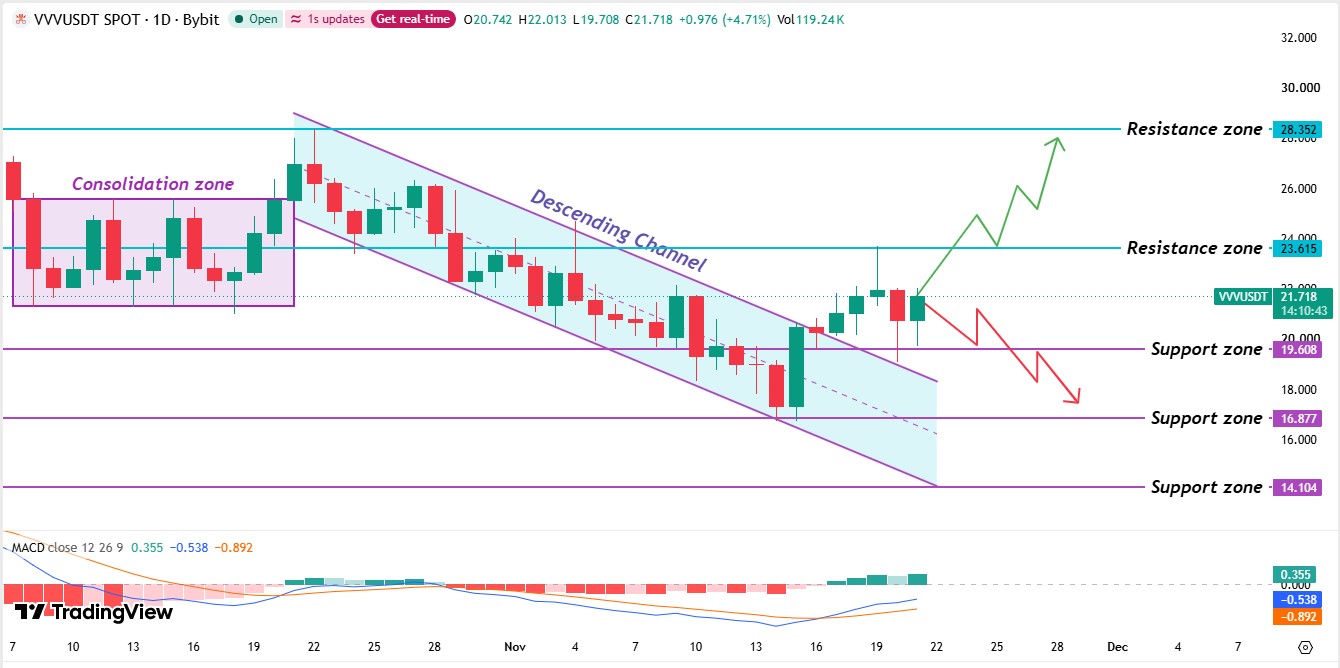
Source: TradingView, VVV/USDT 1D chart on Bybit with MACD (12, 26, 9) shown, captured Nov 21, 2026, 09:58 UTC
$VVV first moved sideways in a consolidation zone, a band where neither side took control. A spike broke the consolidation zone and hit the resistance level at $28.352, and sellers rejected it. A descending channel followed, a sloping band of lower highs and lower lows.
Price then broke under the support level at $19.608, which flipped it into a resistance level. A strong daily candle later broke above the channel and reclaimed it, so it's a support level again.
Buyers pushed to the resistance level at $23.615, but a spike wick was rejected there.
A break above a descending channel signals weaker sellers, and a daily candle back inside it would undo that. Related coverage on VVV shorts and whale risk adds context. Right now, the price trades above the support level at $19.608, below the resistance level at $23.615 and above the channel.
MACD reads -0.538, and the signal line is -0.892. The MACD line sits above the signal line, so momentum is improving. But both lines below zero mean sellers still hold the bigger edge.
Venice token’s support and resistance levels
Level | Type |
$28.352 | Resistance level |
$23.615 | Resistance level |
$19.608 | Support level |
$16.877 | Support level |
$14.104 | Support level |
VVV Price Forecast: Bull, Base, and Bear Scenarios
Bull: A daily candle above the resistance level at $23.615 targets $28.352. A daily candle back below $23.615 cancels it, and rising volume would back the move.
Base: Price stays between $19.608 and $23.615 and trades sideways until a daily candle breaks either level. Steady volume keeps it intact.
Bear: A daily candle trading below the support level at $19.608 targets $16.877, then $14.104. A daily candleback above $19.608 cancels it, and heavy long liquidations would speed the drop.
Listing attention can fade within days, and a few wallets hold nearly all supply. A daily candle back inside the channel would weaken the breakout.
Which $VVV Level Decides the Week Ahead?
According to CoinGabbar analysis, this Venice token Outlook leans cautiously bullish while the price holds above $19.608. The channel break and the rising MACD favor buyers, but the rejection at $23.615 leaves the move unconfirmed. A daily candle trading below $19.608 would cancel the bullish lean and open $16.877.
Disclaimer: This article is for information only and isn't financial advice. Traders should do their own research and risk only what they can afford to lose.