Vine Coin Price Prediction: Are Shorts Trapped Under $0.0115?


Is a second spike in a week a real base, or a fresh trap for late buyers? The price jumped 42.44% in a day, after the first burst faded near $0.0152. The earlier VINE rejection levels show how that ended.
Vine Coin price prediction now depends on a symmetric triangle on the 4H chart. That's two lines drawn through highs and lows, squeezing price from above and below.
Every number below comes from the OKX VINEUSDT chart, CoinMarketCap, CoinGlass, and Solscan.
Vine Coin Price Prediction Data Snapshot
The VINE price today is $0.009236, up 42.44% in 24 hours. The day's range runs from $0.006241 to $0.01199.
Volume, the value traded in 24 hours, is $29.34M. That's up 1019% and equals 316.76% of the $9.21M market cap. All 999.99M tokens circulate across 94.32K wallets, per the CoinMarketCap price page.
Price still sits 98.05% under the $0.4749 all-time high. And volume depends on the source, since $9.76M on CoinGlass Spot and $3.80M on Solscan come from different venues.
VINE Technical Analysis From the Triangle Base to Now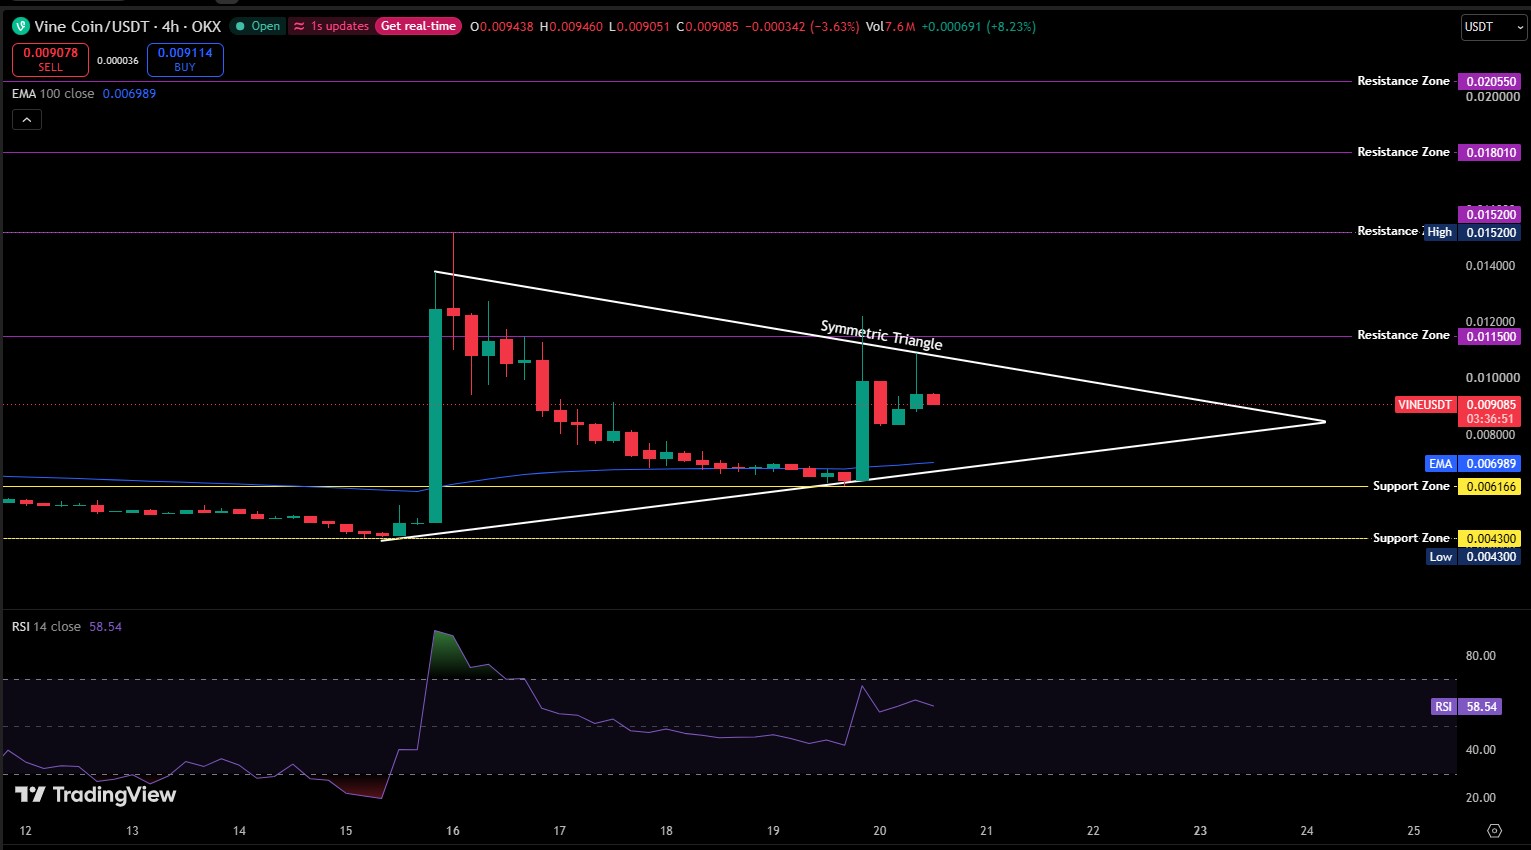
Start at the bottom. Price drifted near $0.0043 on the 4h TradingView chart in tiny candles, and RSI sat under 30.
Then a tall green candle ran to $0.0152, and the RSI jumped past 80. Buyers controlled it for a few hours.
Sellers needed 3 days to undo it. Price stepped down in lower highs and settled on the 100 EMA, an exponential moving average that weights recent candles more, at $0.006989.
Volume dried up there. RSI cooled into the 40.
And the rising line from the $0.0043 low arrived at the same spot. Price tagged both and held above $0.0062, a higher low, and that matters.
The second spike came from that floor. A huge green candle ran to about $0.0120 and hit the falling line near $0.0115. Sellers answered fast.
Price stalled right there. Under $0.0115, again. Later candles tried it twice, and both failed.
Now it trades near $0.0091. RSI is 58.54, well under the 80-plus reading of the first spike, and the latest high of $0.0120 sits under $0.0152. Lower highs plus higher lows are how a triangle forms.
VINE Support and Resistance Levels
VINE support and resistance levels come straight from the chart. Resistance, an area where sellers capped earlier rallies, starts at $0.0115. Above it sit $0.0152, the first spike high, then $0.0180 and $0.0206.
Support, an area where buyers stepped in before, starts at the 100 EMA, $0.006989. Under it, the demand zone at $0.006166 comes next, then the $0.004300 base low.
Why Is VINE Moving Today?
Volume exploded. $29.34M traded, up 1019%. Buyers hit the 100 EMA and the triangle floor. The price ran 42.44%.
It's speculation, and speculation reverses fast. But a real catalyst would change that, and traders can track memecoin news updates for it.
VINE Funding Rate Flips Negative
At -0.6098%, or -667.7% annualized, the VINE funding rate means shorts pay longs. Funding is a fee that passes between the two sides to keep futures near the spot.
At the first spike it was positive at 0.3652%, and longs were crowded. Now shorts are. Crowded and small.
Open interest, the value of open futures contracts, is $1.28K, up 398.65%. Futures volume is $1.69K, and liquidations are $0.00.
Spot net inflow is +360.1K against -374.1 in futures, so spot buyers did the work. A squeeze needs size, and CoinGlass futures data shows none here.
Vine Coin Whale Holders and Exchange Supply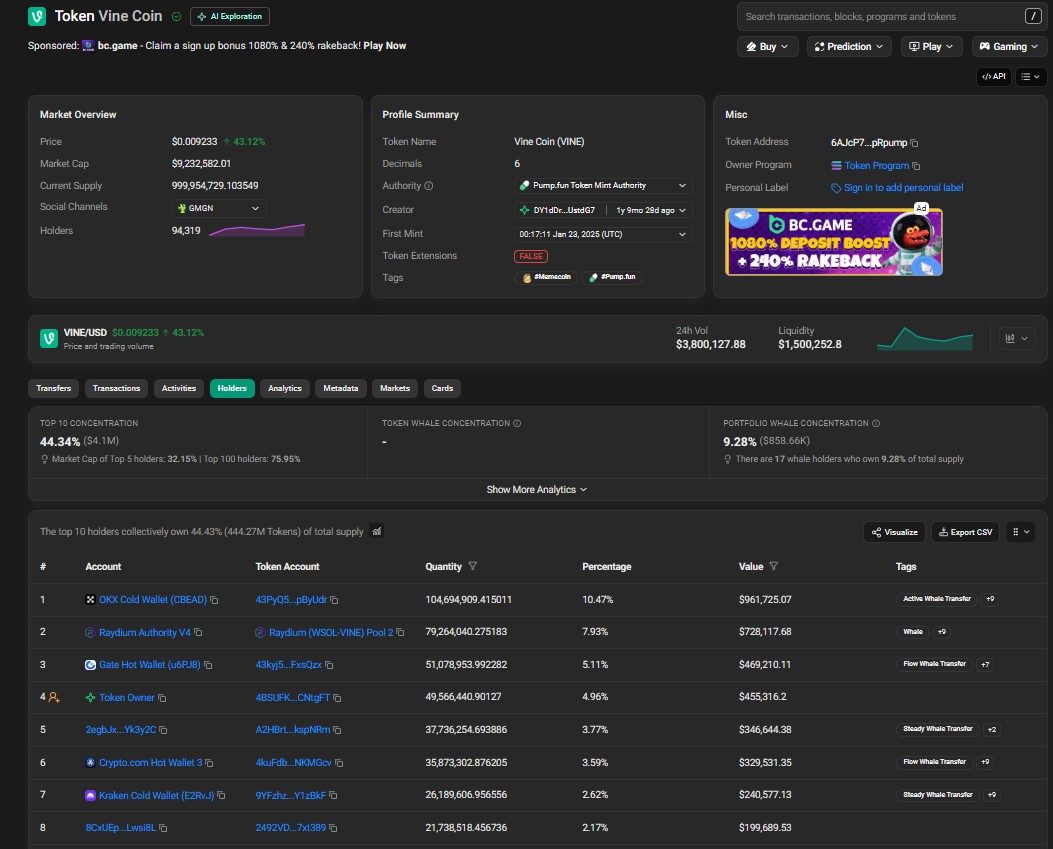
Concentration is heavy. The top 10 wallets, close to half the supply, are at 44.34%, or 444.27M tokens, and 17 whale wallets hold another 9.28%.
Exchange wallets add up to about 21.79%. OKX holds 10.47%, Gate 5.11%, Crypto.com 3.59%, and Kraken 2.62%.
The Raydium pool authority holds 7.93%, and the token owner wallet holds 4.96%. Exchange supply can reach the market in minutes, and a $1.5M pool absorbs large sales badly. Solscan holder data lists the top wallets.
Market Mood Behind the VINE Spike
CoinGlass puts Fear and Greed at 11, Extreme Fear. So who buys a 42.44% candle in that mood?
Thin liquidity makes this a local move, driven by VINE flows rather than a broad market turn. Vine Coin Price Prediction Scenarios and Targets
This VINE price forecast is bullish while the price holds above $0.006989. A 4h trade above $0.0115 confirms it.
Bull Case
A 4h trade above $0.0115 on volume near $29.34M opens at $0.0152, then $0.0180. That's the VINE price projection if buyers break the upper line. A trade back under $0.006989 cancels it.
Base Case
Price ranges between $0.006989 and $0.0115 as the triangle tightens. Candles shrink and volume cools.
Bear Case
A 4h trade under $0.006989 opens at $0.006166, then $0.004300. That would erase both spikes. Reclaiming the 100 EMA cancels it.
Scenario | Trigger | Target | Invalidation | Liquidity Condition |
Bull | 4h trade above $0.0115 | $0.0152, then $0.0180 | Trade under $0.006989 | Volume near $29.34M |
Base | Rejection at $0.0115 | Range $0.006989 to $0.0115 | 4h trade outside range | Volume cools, pool near $1.5M |
Bear | 4h trade under $0.006989 | $0.006166, then $0.004300 | Reclaim of $0.006989 | Thin pool, fading volume |
VINE Price Outlook for the Next Week
Both lines meet a few days out on the 4h chart, so a decision is near. At first the call was bearish after 2 rejections at $0.0115. But the higher low on the 100 EMA changed it.
Expect a test of $0.0115 before the apex. A hold above $0.006989 keeps it alive.
Risks That Could Break the VINE Setup
Liquidity is $1.5M, or 15.94% of market cap. A single large sell moves the price fast.
All 999.99M tokens circulate already, so unlocks aren't a risk. But 10 wallets hold 44.34%.
And the price sits 98.05% under $0.4749, so holders stuck at higher prices may sell into strength. A new venue would add liquidity, and exchange listing updates track those.
Where VINE Stands Now
Above $0.0115, the Vine Coin price prediction turns clearly bullish toward $0.0152. Under $0.006989, it turns bearish toward $0.004300. More setups sit on the latest price predictions page.
Disclaimer. This article is for information only and isn't financial advice. Crypto, and low-cap memecoins in particular, carry a high risk of loss. Readers should research independently before trading.