What Is Capitulation in Crypto? Is the Bitcoin Sell-Off There yet?


What Is Capitulation in Crypto? Is the Bitcoin Sell-Off There Yet?
Every crash has a moment when the last holders give up and sell at any price. Traders call it capitulation, and many now ask whether it has arrived.
Knowing what capitulation is in crypto helps you avoid panic selling at the worst moment. This guide covers the meaning, the signs to check, and what history says about bottoms.
Key Takeaways on Crypto Capitulation
Short answer to what is capitulation in crypto: a wave of panic selling that often ends a sell-off. It is confirmed only later.
Judge several signals together, never one.
On 16 November 2026, fear is extreme, but forced selling is modest.
Extreme fear has not always marked a bottom.
What Is Capitulation in Crypto and Why Does It Happen?
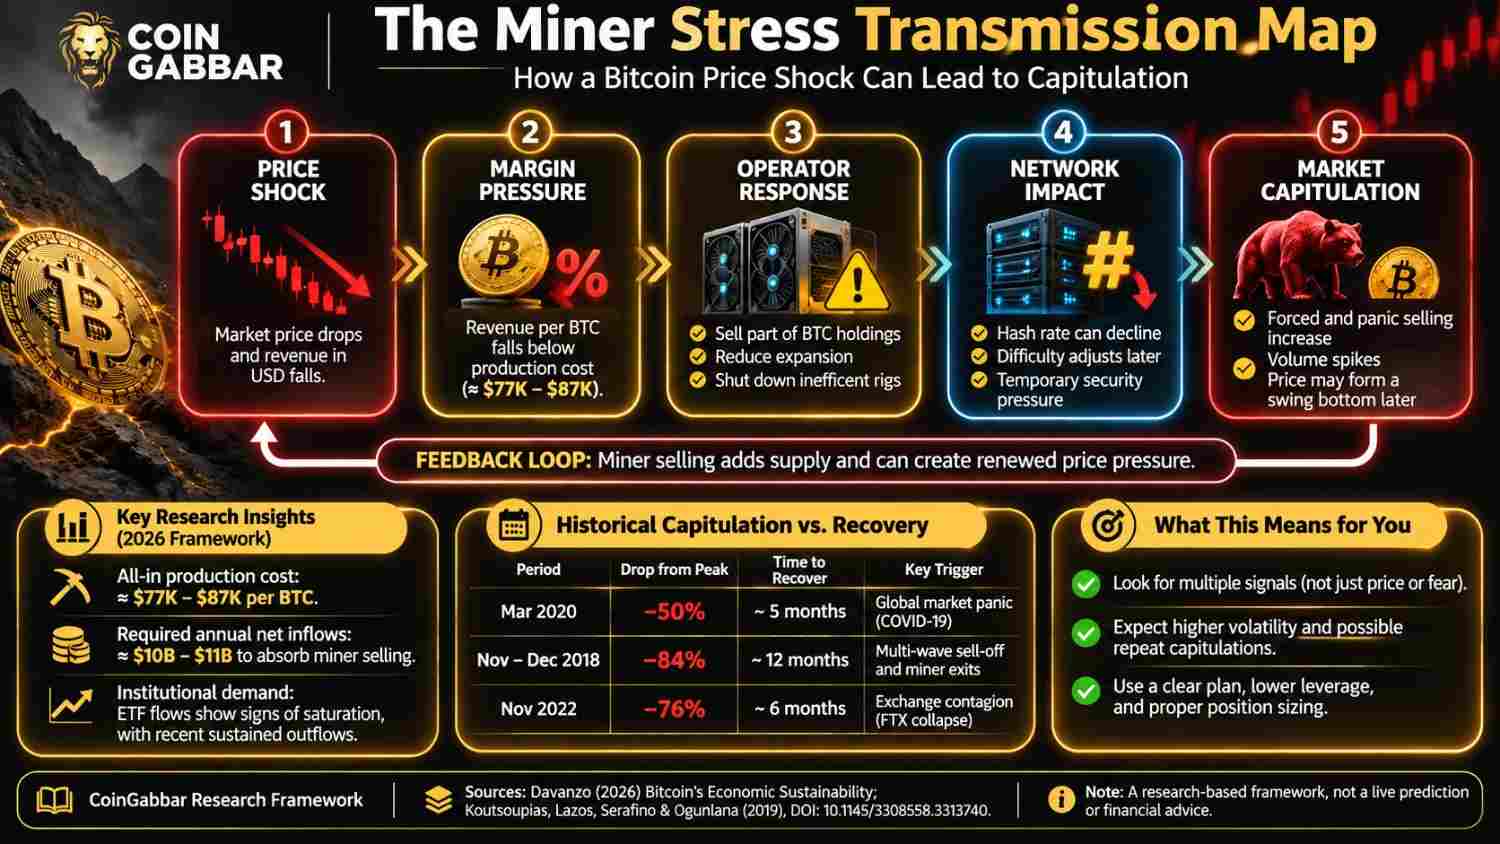
Capitulation is a burst of selling by holders who finally give up. Some sell because losses feel unbearable. Others are sold out when exchanges close their leveraged trades.
That forced selling is called liquidation. When prices fall, leveraged long positions lose margin and close automatically. That pushes prices lower and triggers more closures.
The process ends when few sellers remain. Volume often jumps first, then the price stops falling. Candles often show long lower wicks, where the price drops sharply and bounces back.
What Are the Signs of Crypto Market Capitulation?
So what is capitulation in crypto supposed to look like? Analysts check price, mood, forced selling, fund flows, and on-chain data. On 16 November, Bitcoin traded near $64,500, about 49% below its $126,080 record, according to CoinGecko.
Signal | Past panic reading (rule of thumb) | Reading now | Status |
Fear and Greed Index | About 5 to 13 | 10, extreme fear | Flashing |
Liquidations | One-day spike far above normal | About $1 billion in 24 hours, 14 Nov | Not extreme |
Volume | Often 3x to 5x normal | No verified spike | Unconfirmed |
ETF flows | Heavy, sustained outflows | About $1.07 billion net out, 9 to 13 Nov | Flashing |
Miner and short-term holder selling | Sharp rise | Not verified | Unconfirmed |
Source: Alternative. me, CoinGecko, reported liquidation and ETF data, and CoinGabbar analysis. Checked 16 November 2026.
For scale, the record 2025 liquidation wave erased about $19.1 billion in a day. Today's total is roughly one-twentieth of that.
Has Capitulation Always Marked a Bitcoin Bottom?
No. Reports link the latest slide to hot inflation data, rate-hike bets, and spot ETF outflows. Past panics and bottoms did not always arrive together.
Bitcoin fell about 50% in 48 hours in March 2020, then rebounded. In 2018, it broke $6,000 in November and fell below $3,200 in December, after several waves.
One published analysis of twelve extreme-fear episodes since 2018 found a lower close within 90 days in eleven cases. The median extra drop was 15.2%.
The same analysis shows mixed results this year. A reading of 12 on 5 February had no lower close. A reading of 11 on 3 June was followed by a further 8.6% fall.
How Should Investors Act During Capitulation?
Once you know what capitulation in crypto is, the practical question is risk, because nobody can call the bottom live. Investors often compare four choices.
Leverage: borrowed positions drive forced selling, and lower leverage removes that risk.
Entry: Buying in stages spreads timing risk, yet it cannot prevent further falls.
Cash buffer: spare cash covers expenses without selling at a loss.
Plan: a written entry and exit plan made before a fall limits emotional decisions.
None of these choices removes price risk. Analyst ranges for the year are covered in our 2026 Bitcoin price outlook.
Final Thoughts on Crypto Capitulation
In short, what is capitulation in crypto? It is a panic-selling wave that looks like a bottom only afterwards.
The Fear and Greed Index read 10 on 16 November, yet forced selling stayed modest. Watch ETF flows, forced selling, and daily closes before you decide. A reading of 10 is a warning light, not a verdict.
Expert Opinion
CoinGabbar analysis suggests that what is capitulation in crypto matters less than how many signals line up. A single wave rarely confirms a bottom, and extreme fear can last for months. Readers who track the fear index, forced selling, and ETF flows together get a clearer picture than any one chart gives. This view rests on the signal table above and is not a forecast.
Disclaimer :This article is educational and is not financial advice. Returns are never promised or assured. Crypto prices are volatile, and leveraged positions can be liquidated. Consult a qualified adviser before you invest.