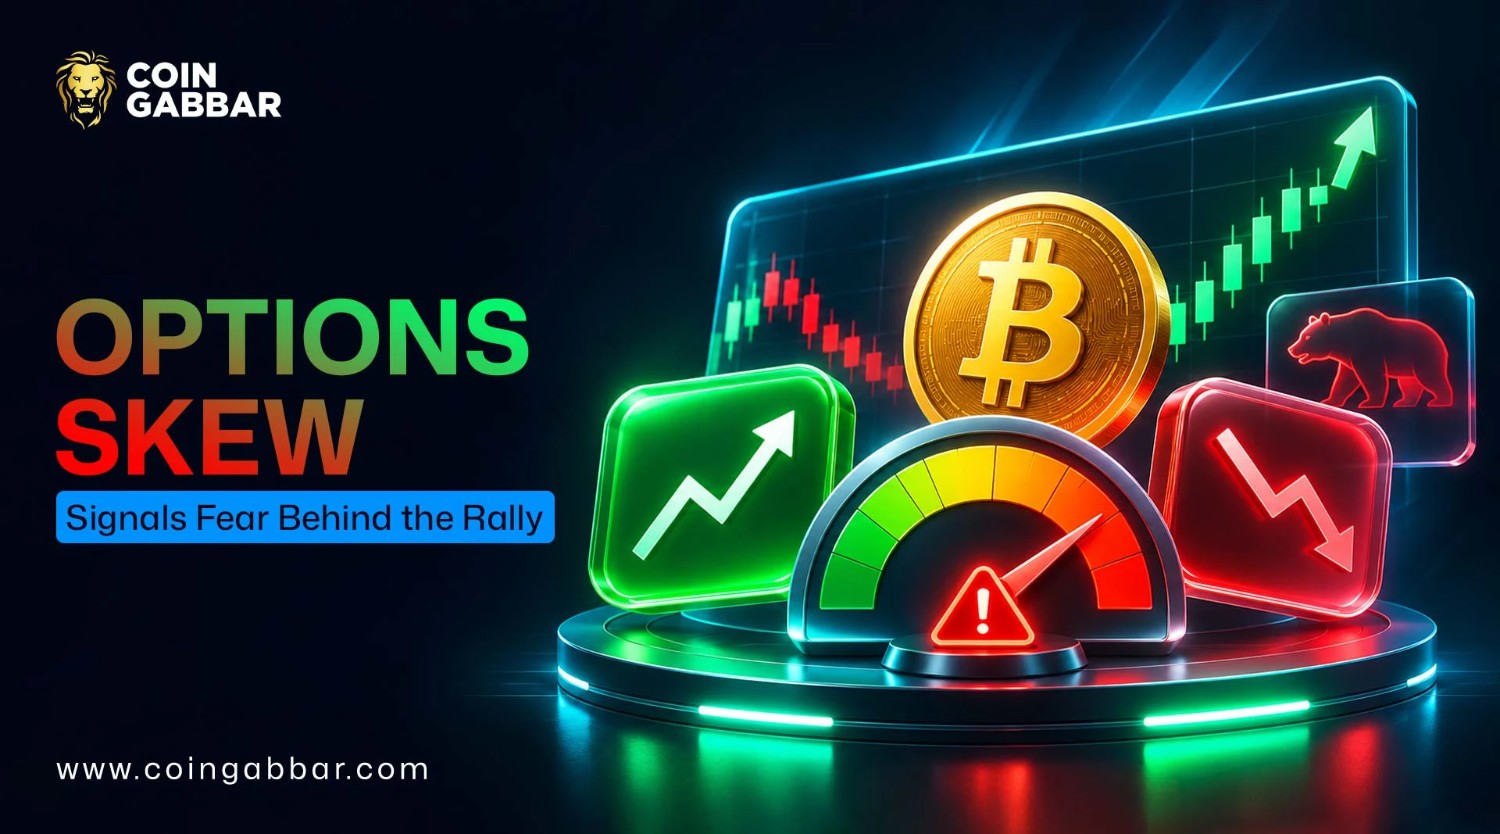
What Is Options Skew? The Chart Shows Traders Doubt This Rally

Why Options Skew Matters When a Rally Feels Too Strong
Crypto prices are climbing, and crypto news today is full of green charts. But rising prices don’t always mean traders feel sure. Many are quietly buying protection. Options Skew is the gap in implied volatility between put and call options, and it works as a quick read on that hidden worry.
When puts carry higher implied volatility, traders are paying a premium for downside protection. It describes pricing, not a guaranteed forecast. This guide explains how the chart works, what the latest reading shows, and why the setup raises questions about crypto rally sustainability.
What Is Options Skew in Crypto Trading?
Options Skew, also called volatility skew, compares implied volatility across options that expire on the same date but have different strike prices. Implied volatility is the market’s forecast of how far a price may swing.
A strike price is the fixed price in an option contract. Call options give the right to buy, and put options give the right to sell. So what does "options skew" indicate in crypto? It shows whether traders lean toward upside exposure or toward downside protection. Because coins can fall fast, options market sentiment often shifts before spot prices do.
How Does Options Skew Work?
In theory, implied volatility should match at every strike. Real markets bend it into a curve because buyers and sellers want some strikes more than others. This is how volatility works as a fear gauge.
A 25-delta option is a far-out contract with roughly a 25% chance of finishing in the money. Take an illustrative example: if a 25-delta put trades at 45% implied volatility and a 25-delta call at 38%, put-minus-call skew is +7 points.
These figures aren’t live data. The risk reversal is that same gap. Providers use different formulas, though, so a positive number means expensive puts only under a put-minus-call convention. Readers should always check the method first.
What Does the Options Skew Chart Tell Traders?
The chart plots implied volatility against strike prices. When the curve slopes down toward lower strikes, it forms a volatility smirk, meaning put implied volatility exceeds call implied volatility.
Putting skew vs. call skew is the key comparison, because call skew tends to appear when traders chase upside during bull runs. If both ends of the curve rise, the shape is a volatility smile, which points to worry on both sides.
A steep put skew means heavy demand for crash cover. Changes in shape track crypto market sentiment, so a flatter curve can signal easing fear while a steeper one signals growing caution.
Why Does the Chart Suggest Traders Doubt This Rally?
At first, the rally seemed clean. Prices rose, and headlines turned upbeat. Then the derivatives data told a different story. According to Glassnode’s report dated October 19, 2026, Bitcoin’s 25-delta skew rose from 5.2% to 8.6% over the prior week, meaning protective puts became pricier relative to bullish calls.
The provider uses its own method, so readers should confirm the expiry and formula in the original report. Yet rising prices alongside climbing put demand in an odd mix. Normally, fear fades as prices rise.
Here, traders appear to be hedging against a pullback instead of chasing gains. Put demand doesn’t always signal bearish views, though. Funds buy puts as portfolio insurance, structured products create hedging flows, and market makers adjust positions to manage their own risk. Could a rally built on hedges really last? That question sits behind crypto rally sustainability.
Options Skew vs. Put-Call Ratio: What’s the Difference?
Options skew measures price: how much more implied volatility puts carry than calls. The put-call ratio measures activity: how many put contracts trade or stay open compared with calls.
A high ratio beside a calm skew may point to routine hedging. Steep skew with a low ratio may mean protection is costly because few traders are active. Used together, the two give a clearer picture of options market sentiment than either alone.
What Can Options Skew Mean for Bitcoin and Ethereum?
Bitcoin option skew gets the most attention, because the Bitcoin options market is the largest in crypto, and institutional hedging of large holdings can lift put prices quickly.
Ethereum option skew often moves in the same direction, though that market is smaller, so readings can jump more. In strong rallies, skew can swing toward calls as traders chase gains. Sharp drops push it back toward puts.
Comparing both assets shows whether the options market positioning is cautious across the board or limited to one coin. India crypto news readers tracking global derivatives market positioning can use these shifts as context.
How Can Traders Use Options Skew to Identify Market Risk?
Traders can start by tracking implied volatility, then compare call demand with put demand across expiry dates. Next comes the 25-delta risk reversal, which gives one number to follow over time.
Funding rates, open interest, and trading volume add context, because crowded bets can make hedging more urgent. Turns out, an options skew reading means little on its own.
A jump in puts while open interest falls tells a different story than the same jump during rising leverage. Relying on one indicator alone invites mistakes. Live readings are available from major derivatives data platforms and exchange options pages.
Is Options Skew a Reliable Indicator of a Market Reversal?
Options Skew shows where traders feel nervous, but it can’t say where prices will go. Bearish hedging doesn’t guarantee a price drop, since many hedgers only protect gains they plan to keep.
Readings also change with expiry date, data provider, and formula, so comparisons across sources can be misleading. Sudden market news, such as new rules, exchange trouble, or major economic data, can reshape positioning within hours.
High put skew can also appear near short-term lows, when fear peaks. Skew works best as a warning light, used with other indicators, never as a standalone reversal call.
Final Thoughts: What Options Skew Says About This Rally
Options Skew shows that a rising market can still carry hidden worry. Price tells where traders have been, while skew shows what they’re paying to stay protected.
The current setup, as of November 13, 2026, points to careful positioning, not strong belief, though readings can change fast. Before forming any view, readers should check live data, the provider’s method, and the expiry used, along with other indicators.
Disclaimer
This article is for informational purposes only and isn’t financial advice. Crypto and options trading carry high risk, and prices can change fast. Readers should do their own research and talk to a licensed adviser before making any decision.