Why Blockchain Activity Can Be Misleading Even on a Public Ledger


Why Does Public Blockchain Activity Not Tell the Whole Story?
A public ledger feels like proof. Every transfer is recorded, every wallet is visible, and anyone can pull the numbers. Yet blockchain activity is one of the hardest things in crypto to count honestly. This September, researchers at the Bank for International Settlements showed that the same Bitcoin data can produce very different totals, depending on one counting choice.
Why Does Public Blockchain Activity Not Tell the Whole Story?
A blockchain records what happened. It does not record why. A transfer can be a payment, a move between your own wallets, an exchange shuffling coins, or a bot trading with itself. The ledger shows all four the same way.
That gap is a measurement problem, and it sits behind many headline numbers: transfer volume, active contracts, total value locked.
The BIS paper, Working Paper No. 1377, says common indicators are noisy approximations. They are not direct measures of economic activity. The data is open. The economics are not.
How Can One Bitcoin Transaction Look Six Times Bigger?
Bitcoin does not keep account balances. It keeps unspent outputs. Think of a 500 rupee note. You buy something worth 120 rupees, hand over the note, and get 380 back. The ledger saw 500 move, though only 120 was spent.
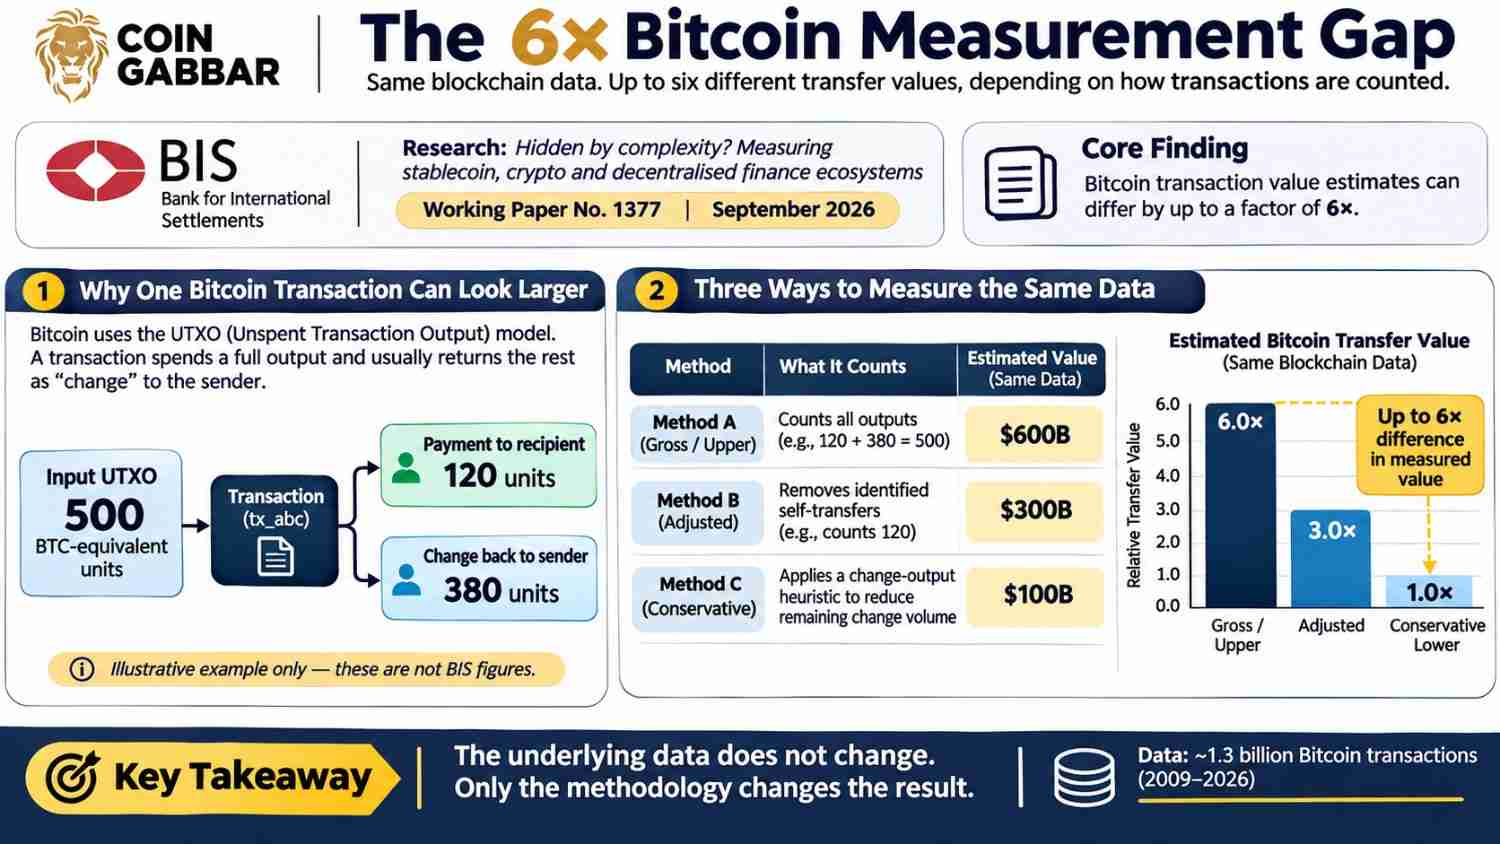
Bitcoin works the same way. A transaction must spend a whole output and usually returns the rest to the sender as change. Count every output, and you count your own change as a payment. Our guide to on-chain analysis explained why traders watch such numbers closely.
The BIS tested this on about 1.3 billion Bitcoin transactions from 2009 to 2026. Removing self-transfers cut measured flows by up to a factor of six. The authors note that the unadjusted figure is the one widely reported as transfer value.
What Did MIT and LSE Find Behind Bitcoin Transfer Volume?
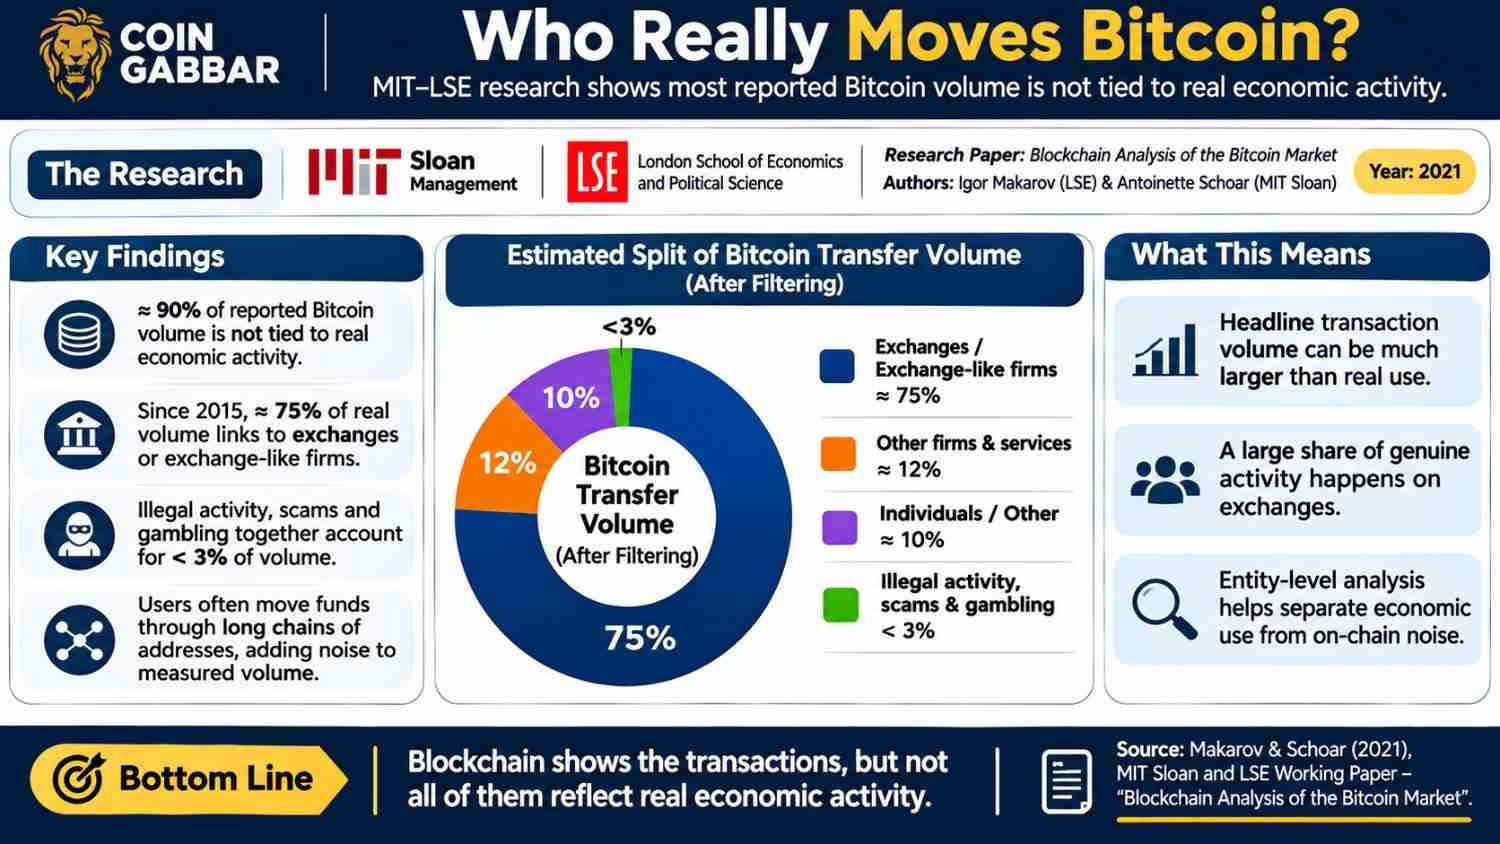
Igor Makarov of the London School of Economics and Antoinette Schoar of MIT Sloan linked Bitcoin addresses to real entities. Their 2021 working paper put it bluntly. About 90% of volume is not tied to real economic activity.
They call it a by-product of protocol design. Users also hide funds behind long chains of addresses. After filtering that noise, they found that since 2015, about 75% of real volume links to exchanges or firms that act like them.
Illegal activity, scams, and gambling together made up under 3% of volume in their estimate. These papers count different things, so we do not stack their numbers.
Do Millions of Smart Contracts Mean Millions of Real Users?
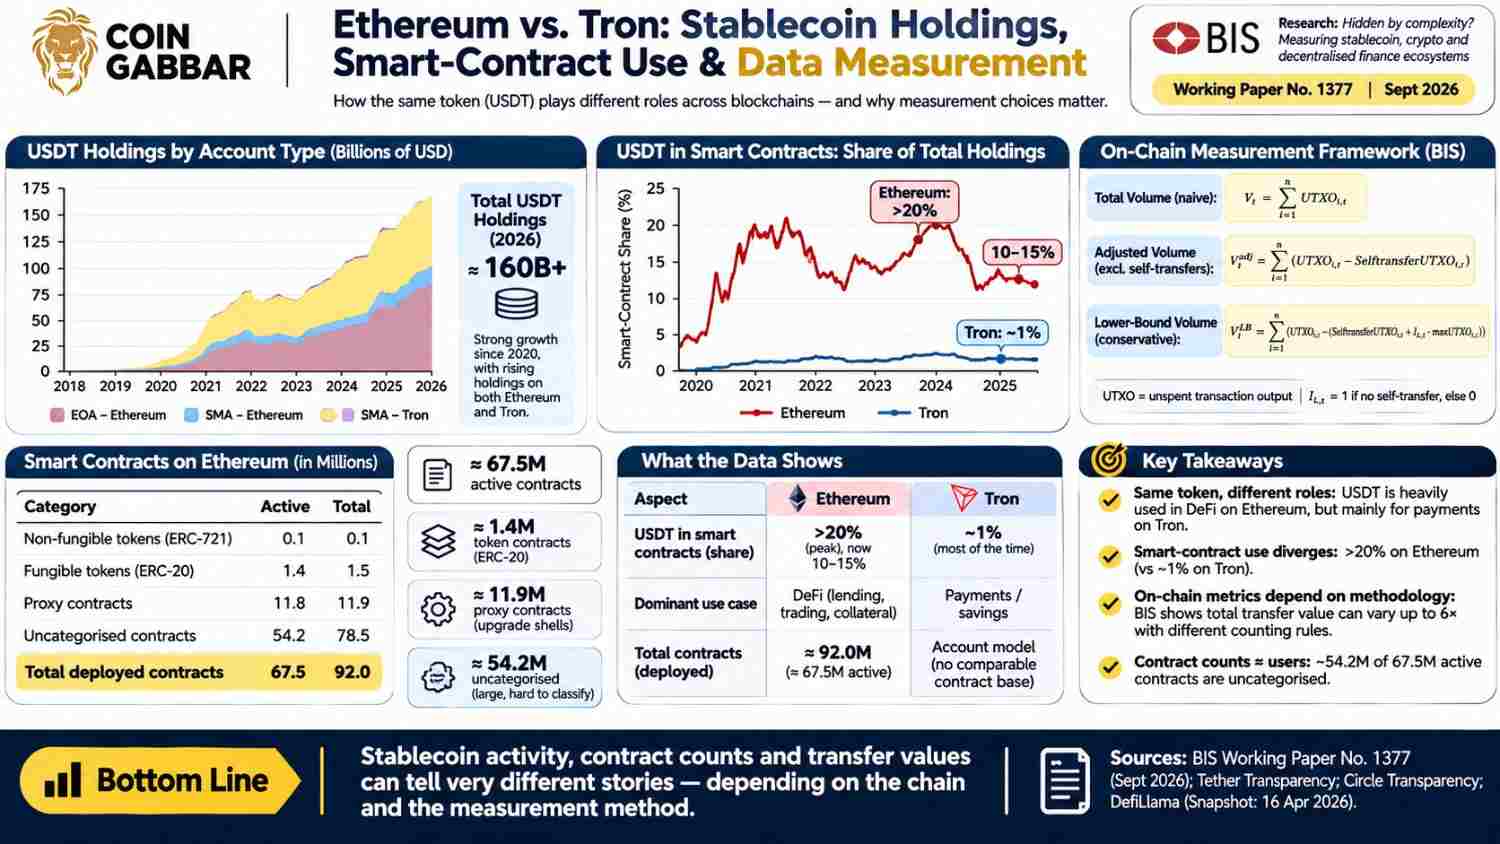
No. The BIS counted 67.5 million deployed and active contracts on Ethereum. Over 54 million could not be sorted by any standard technical type.
It classified 13 million. About 1.4 million of those issue tokens. The biggest group, at close to 12 million, was proxy contracts, which are upgrade shells.
Copying is common too. The symbol USDT appears across roughly 7,000 token contracts. Many mimic the real one. A contract count shows how much code was deployed. It cannot show how many users or businesses exist.
Is Stablecoin Activity the Same on Ethereum and Tron?
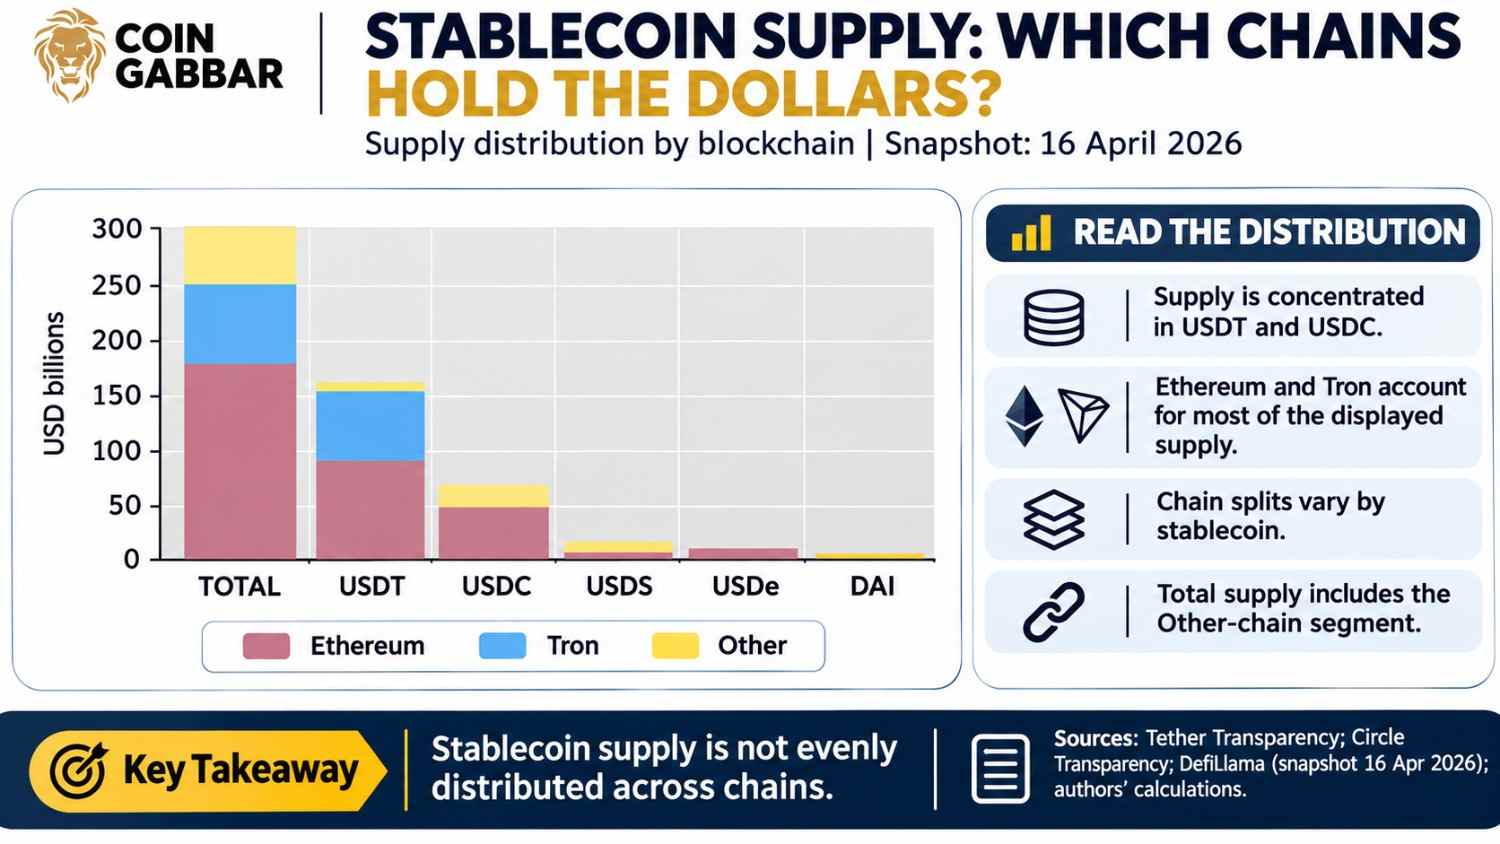
It is not. The BIS tracked how much USDT sits inside smart contracts. On Ethereum, that share rose above 20%. After late 2024 it fell to 10% to 15%. On Tron it stayed near 1% most of the time.
On Ethereum, USDT often acts as collateral or liquidity in lending and trading. On Tron it looks more like payments or savings. Same token, different job. The paper adds that after the GENIUS Act, issuance rose, but smart contract holdings did not follow for long. Issuance and DeFi use can drift apart.
What Does Blockchain Activity Miss Outside the Public Ledger?
Plenty. An IMF working paper by Eugenio Cerutti, Jiaqian Chen, and Martina Hengge, published in April 2024, studied Bitcoin cross-border flows both on-chain and off-chain.
On-chain transactions were on average much larger than off-chain ones. Off-chain flows also seemed linked to a wish to avoid capital flow limits. The authors admit their exchange data covers only part of the off-chain world.
A Harvard Kennedy School and NBER study of peer-to-peer Bitcoin trades across more than 135 currencies makes a similar point. Much real usage never shows up as a simple public transfer.
How Should Investors Read On-Chain Numbers Before Trusting Them?
Start with one question. What exactly is being counted? Gross outputs, adjusted transfers, and exchange moves are three different things.
Look for ranges, not single figures. The BIS itself proposes bounded estimates with stated assumptions. Compare chains with care, and never merge one token’s activity across networks.
Price is another trap. In price surges, the BIS found simple market cap rose to as much as four times realised cap. A chart that looks like growth may be a counting choice.
Expert Opinion: Is Crypto Growth Being Measured Wrong?
CoinGabbar analysis suggests that headline blockchain activity numbers are best read as upper limits, not as final counts.
This view rests on our reading of the BIS working paper, the IMF primer, and the MIT and LSE study.
None of them say on-chain data is useless. All say the method matters as much as the data.
















