XRP Forecast: Bears Target $0.80 After Sliding to Fresh Two-Year Low

XRP dropped to $0.8951 on Saturday, November 21. That is its lowest level since November 16, 2024.
On Friday, the token traded near $0.96. It has now spent a week unable to get back above $1.
The coin is about 74% below its July 2025 peak of $3.56. It has also lost roughly a quarter of its value in the past month. Money has been leaving the wider crypto market, and the pain is not limited to one coin.
Another Rough November for Ripple's Token
The monthly numbers look ugly. The token is down 28.40% in November and about 52% since January, as per CoinGlass data.
History does not offer much comfort. In November 2021, it lost 10.28%, then fell another 16.78% in December. In November 2022, the month of the FTX collapse, it dropped 12.27%.
December 2022 added a 16.84% loss. The year ended down about 59.10%. Then January 2023 brought a 19.55% gain.
Period | Return |
November 2021 | -10.28% |
December 2021 | -16.78% |
November 2022 | -12.27% |
December 2022 | -16.84% |
January 2023 | +19.55% |
November 2026 (so far) | -28.40% |
Median November | -10.28% |
Median December | -4.07% |
Longs Get Hit, ETFs See Outflows
Traders betting on a bounce took the heavy damage. Over 24 hours, total liquidations reached $31.47M. Longs made up $29.37M, while shorts were only $2.10M.
The 12-hour figure was $14.40M, with $12.96M from longs. In the latest hour, though, shorts led. Of the $90.81K liquidated, $60.60K came from shorts.
That may hint the heavy flush is slowing. It is too early to say.
Spot XRP ETFs have lost about $26 million to outflows since November began. About $19.1 million of that left in the week ending November 13.
On November 20, the funds saw a daily net outflow of $4.97M. Cumulative net inflows still stand at $1.78B. Total net assets are about $989.61M, or 1.75% of the market cap.
Bitwise holds the most assets at $357.15M. Franklin follows with $280.18M, then Canary with $211.32M.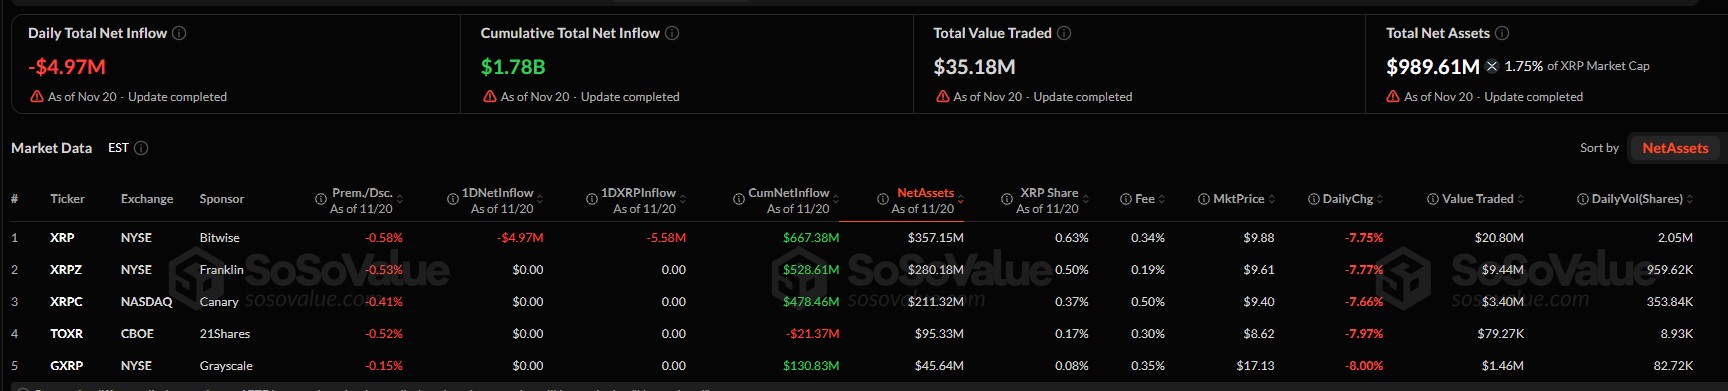
Fed Rate Risk Adds Pressure
The macro picture is not helping. CME data for the December 9 Fed meeting shows an 88.6% chance of a hike to the 4.00% to 4.25% range.
Only 11.4% of traders expect rates to stay at 3.75% to 4.00%. A month ago, hike odds were 76.3%.
Higher rates often weigh on risk assets like crypto. That could keep buyers cautious into December.
Weekly Chart Shows Bears in Control
The weekly chart shows lower highs and lower lows since the peak near $3.60. Price has now broken below the $0.985 support zone.
It also trades under all four major moving averages. The 20, 50, 100 and 200 EMAs sit near $1.24, $1.43, $1.53 and $1.36.
Analyst Ali Charts noted a break below the $0.99 lower edge of a channel. He is watching $0.80 and $0.64 as the next major supports. For the bearish view to weaken, he says $0.99 must be reclaimed.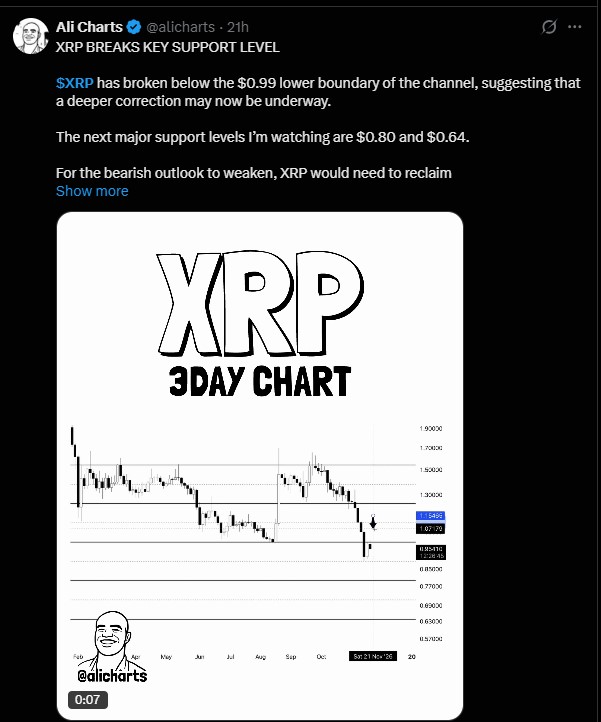
Level | Type | What it means |
$1.35 to $1.53 | Resistance | Stronger EMA cluster |
$1.10 to $1.24 | Resistance | First recovery target |
$0.985 to $1.00 | Resistance | Broken support, key reclaim |
$0.85 | Support | Nearest downside level |
$0.80 | Support | Next major support |
$0.75 to $0.70 | Support | Deeper downside zone |
$0.64 | Support | Lower major support |
What Could Happen Next
If XRP fails to reclaim the $0.98 to $1.00 area, a move toward $0.85 looks possible. Further slips toward $0.75 to $0.70 cannot be ruled out.
If buyers win back $0.985 and hold it, a bounce toward $1.10 to $1.24 could follow. Stronger resistance waits near $1.35 to $1.53.
There is a small bullish note. The monthly Stochastic RSI showed similar fakeouts near oversold levels in 2020 and 2023. Strong rebounds came after both.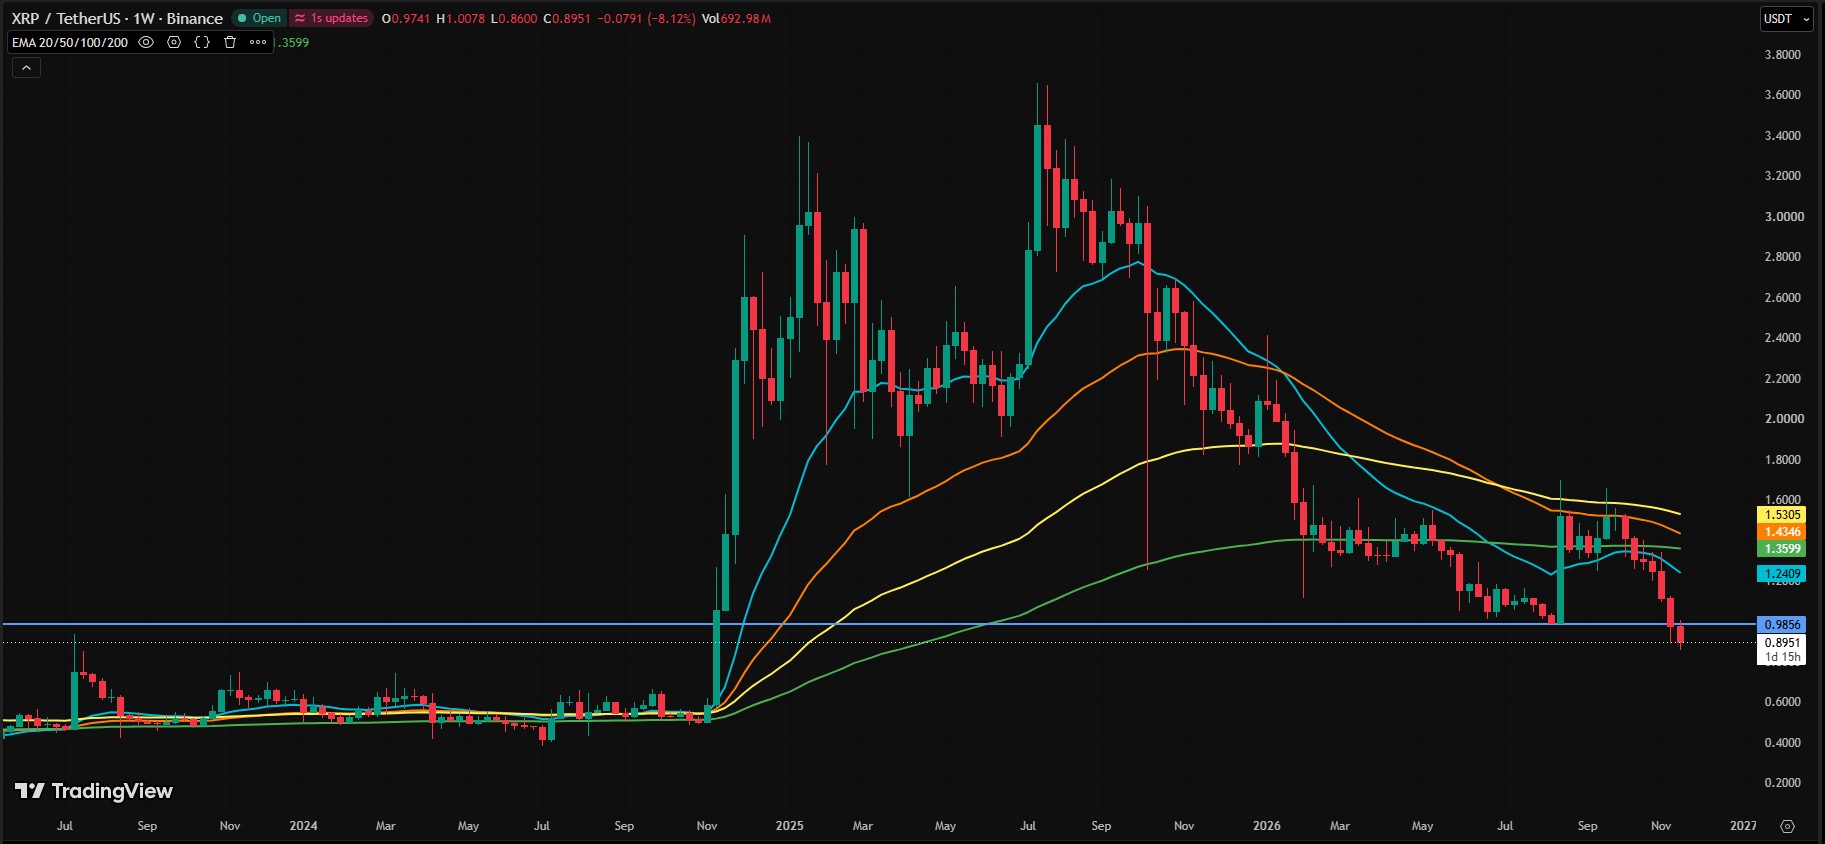
That does not mean history will repeat. For now, the weekly chart still leans bearish, and a sustained move above the broken support would be needed to show a trend change.
Disclaimer
This article is for information only and is not financial, investment, or trading advice. Crypto assets are volatile and carry a high risk of loss. Price forecasts and technical levels are not guaranteed. Always do your own research and speak with a licensed financial adviser before making any investment decision.