XRP Price Prediction: Evernorth Lists as XRPN, Can XRP Hold $1.40?

XRP price is trading near $1.41 on October 10, 2026, up 0.26% in 24 hours. The token is bouncing after four days of losses across the crypto market.
The bigger XRP news today comes from Evernorth. The XRP treasury firm has finished its merger, and its stock is set to start trading on Nasdaq on October 12.
Here is what the numbers and the chart show.
XRP Price Today: How Much Is XRP Worth Right Now?
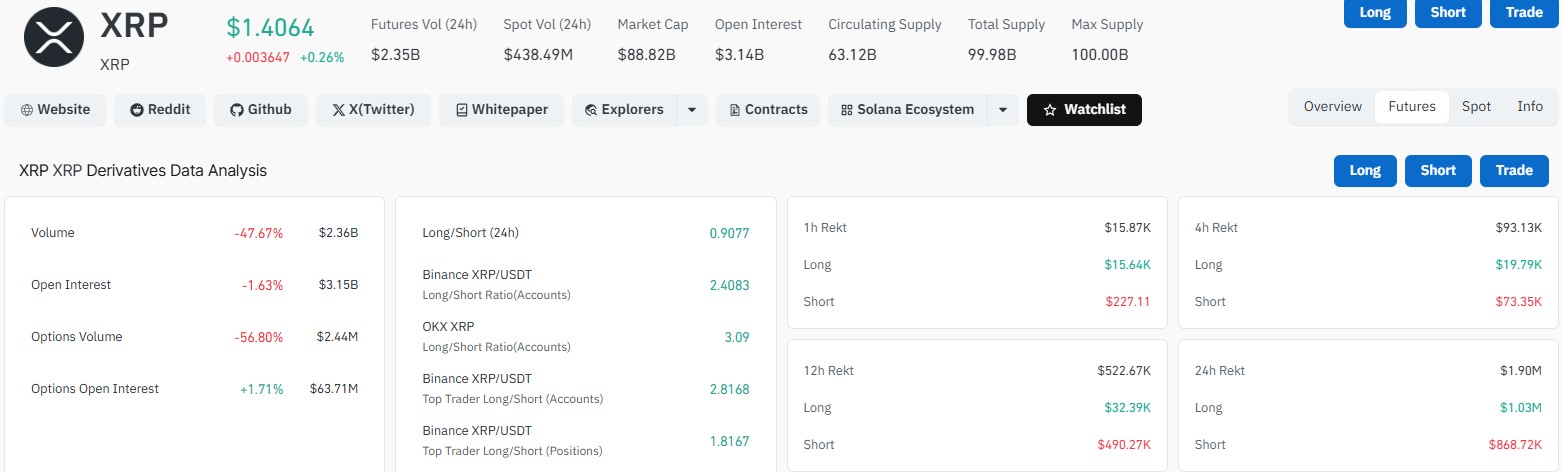
The XRP price today is $1.4064, with a market cap of $88.82 billion. Bitcoin is above $82,500, and Ethereum is near $2,490. The total crypto market cap is about $2.80 trillion, up 0.20%.
Metric | Value |
Price | $1.4064 |
24h change | +0.26% |
Market cap | $88.82 billion |
Spot volume (24h) | $438.49 million |
Futures volume (24h) | $2.36 billion |
Open interest | $3.15 billion |
Circulating / total/max supply | 63.12B / 99.98B / 100B |
XRP News Today: Did Evernorth Complete Its Merger?
Yes. As per the Press Release, Evernorth Holdings, Inc. has completed its business combination with Armada Acquisition Corp. II. The stock should begin trading on Nasdaq under the ticker XRPN on October 12, 2026.
At closing, the company holds about 473 million XRP. At today's price, that is roughly $665 million. It also raised about $300 million in gross cash, before expenses.
Backers include Arrington Capital, SBI Group, Ripple, Pantera Capital, Kraken and GSR. Evernorth plans to ring the Nasdaq closing bell on October 14.
CEO Asheesh Birla said the goal is to grow XRP per share over time. That is a stated aim, not a promise.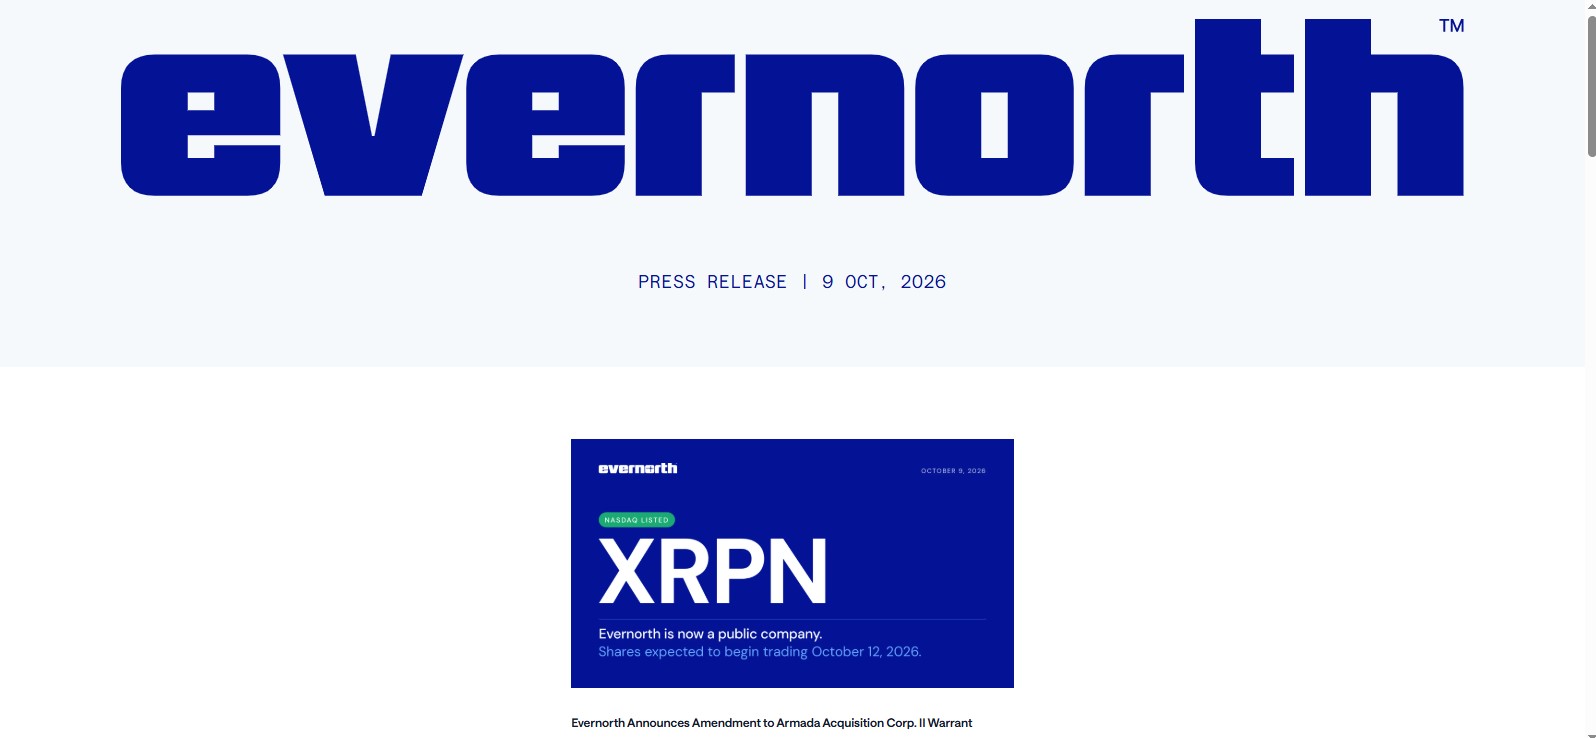
XRP News: What Do Derivatives and ETF Data Show?
Traders look less active. Futures volume fell 47.67% to $2.36 billion, and open interest slipped 1.63% to $3.15 billion. Options volume dropped 56.80% to $2.44 million, while options open interest rose 1.71% to $63.71 million.
The overall long/short ratio is 0.9077. Below 1 means slightly more shorts. Still, Binance XRP/USDT accounts show 2.4083, OKX shows 3.09, and Binance top traders show 2.8168 by accounts and 1.8167 by positions. The mood is mixed.
Liquidations were small. Shorts took most of the pain in the last 12 hours, as per CoinGlass data.
Window | Total | Longs | Shorts |
1 hour | $15.87K | $15.64K | $227.11 |
4 hours | $93.13K | $19.79K | $73.35K |
12 hours | $522.67K | $32.39K | $490.27K |
24 hours | $1.90M | $1.03M | $868.72K |
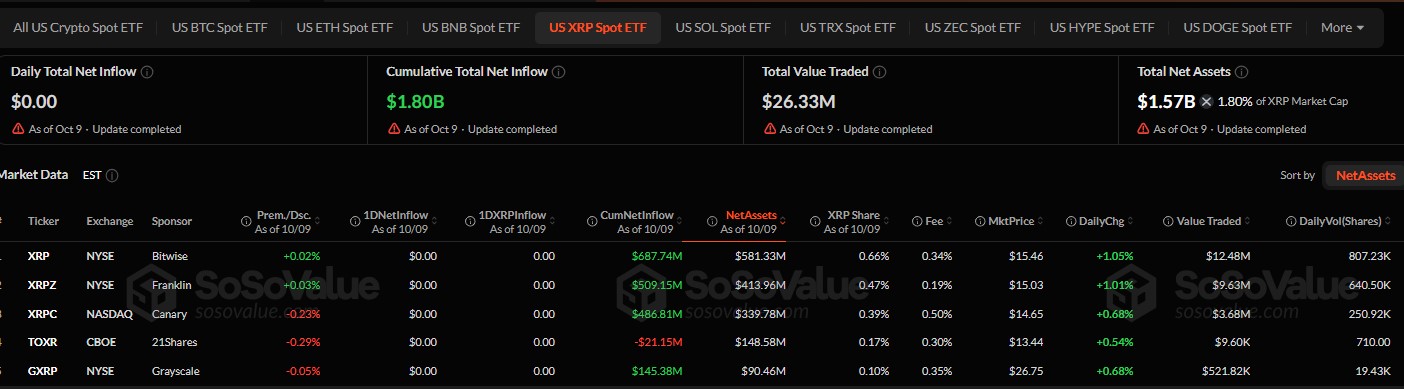
US spot ETFs tell a quieter story. Cumulative net inflows are $1.80 billion, and net assets are $1.57 billion, about 1.80% of market cap. Daily net inflow was $0.00 on October 9, and total value traded was $26.33 million.
Fund | Ticker | Cumulative Net Inflow | Net Assets | Fee |
Bitwise | XRP | $687.74M | $581.33M | 0.34% |
Franklin | XRPZ | $509.15M | $413.96M | 0.19% |
Canary | XRPC | $486.81M | $339.78M | 0.50% |
21Shares | TOXR | -$21.15M | $148.58M | 0.30% |
Grayscale | GXRP | $145.38M | $90.46M | 0.35% |
XRP Price Forecast: What Does the Daily Chart Say?
On the daily chart, price rallied from about $0.95 in August, when Supertrend flashed a buy signal, to above $1.60. It then slid into a descending channel with lower highs under a falling trendline.
Buyers stepped in near $1.35 this week. The Supertrend support line sits at $1.30. Today's Binance candle opened at $1.3958, traded between $1.3957 and $1.4130, and sits near $1.4057.
RSI is 44.79, below the neutral 50 mark, and its average line reads 52.85. That points to slightly bearish momentum.
XRP Price Prediction: Will XRP Go Up or Down?
Our XRP price prediction is neutral to bearish in the short term, until price breaks the descending trendline.
Level | Zone | What It Could Mean |
Resistance | $1.45 to $1.50 | Trendline and key barrier, with a horizontal level near $1.48 |
Upside targets | $1.55 and $1.60 | Possible if a daily candle closes above the trendline |
Support 1 | $1.35 | Recent bounce area |
Support 2 | $1.30 | Supertrend line, possible retest |
Support 3 | $1.25 | Next stop if selling grows |
A daily close above $1.50 would help the bulls. A drop under $1.35 could open the door to $1.30 and then $1.25.
Nobody knows which way it breaks. The Nasdaq debut may bring fresh attention. It could also turn into a sell-the-news moment.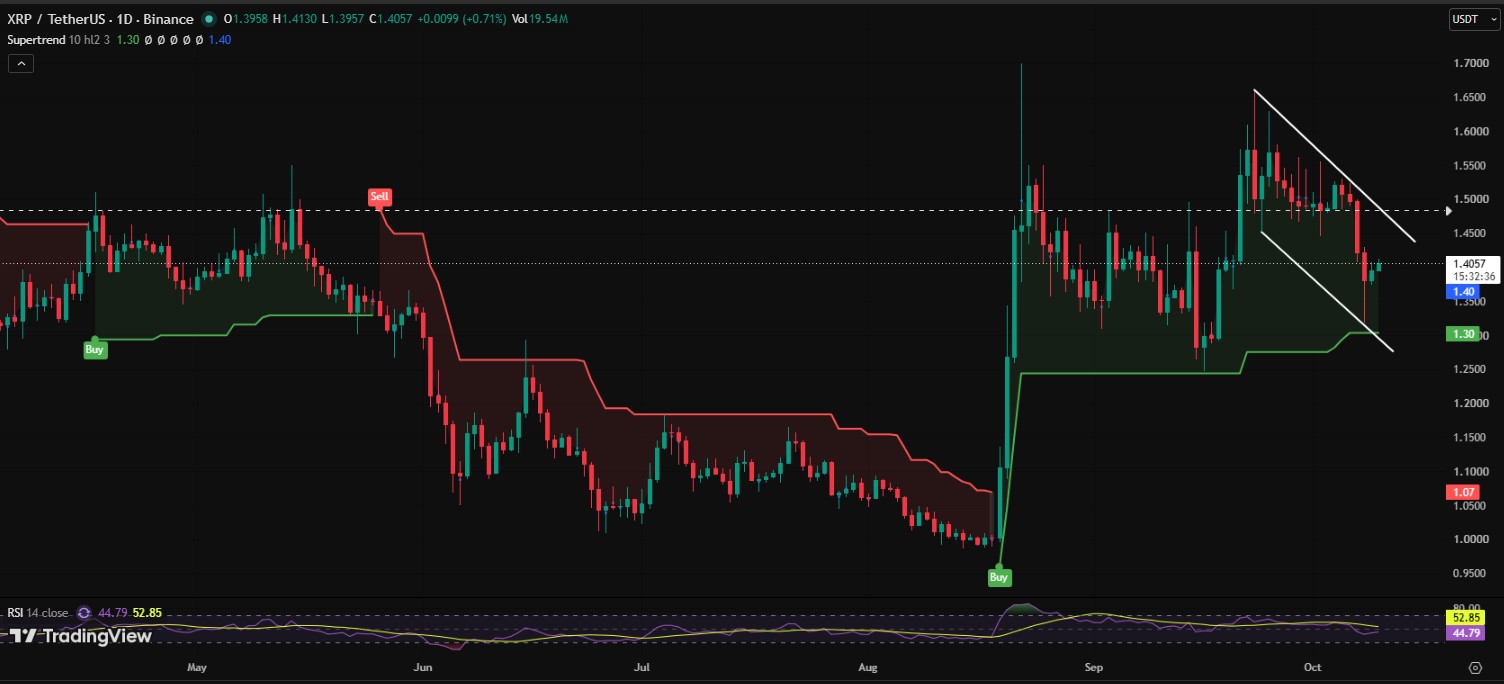
XRP Latest News: What Should Traders Watch Next?
The latest XRP news points to a busy few days.
October 12: First expected trading day for XRPN.
October 14: Planned Nasdaq closing bell ceremony.
ETF flows: Do they move off the $0.00 daily mark?
Chart: Does a daily candle close above the falling trendline?
Disclaimer
This article is for information only. It is not financial, investment or trading advice. Crypto prices are very volatile, and you can lose some or all of your money. Price levels and forecasts are not guarantees. Do your own research and speak with a licensed financial advisor before you make any decision.

















