XRP Price Prediction: Liquidity Drops to 3-Month Low, Is $0.94 Next?


This XRP price prediction starts with a warning sign: liquidity on Binance has fallen to a three-month low.
The token trades near $0.98 on November 18, 2026, close to a key support zone.
The 30-day liquidity index dropped to about 0.041. That is a sign the market is getting thinner just as the price slides.
Binance Liquidity Index Hits 0.041
The index was much higher between late 2025 and early 2026. Since then it has moved mostly lower.
Binance Liquidity Data | Reading |
30-Day Liquidity Index | About 0.041 |
Status | Three-month low |
30-Day Trading Volume | About $2.71 billion |
Price at Time of Data | Near $0.96 |
Low liquidity is not bullish or bearish by itself. But it can make the price react more to big orders.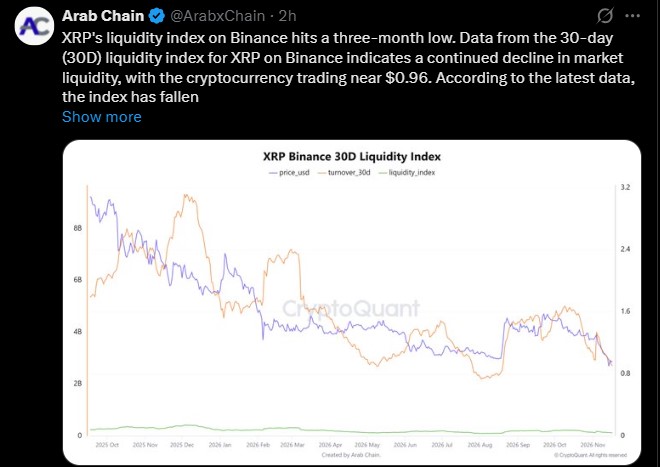
Why Thin Liquidity Matters for Price
When fewer orders sit in the book, one large trade can move the price further. Sudden spikes in volume can then bring sharp swings.
That adds risk around support. A small push could break a level that would hold in a deeper market.
Weekly Chart Shows Sellers in Control
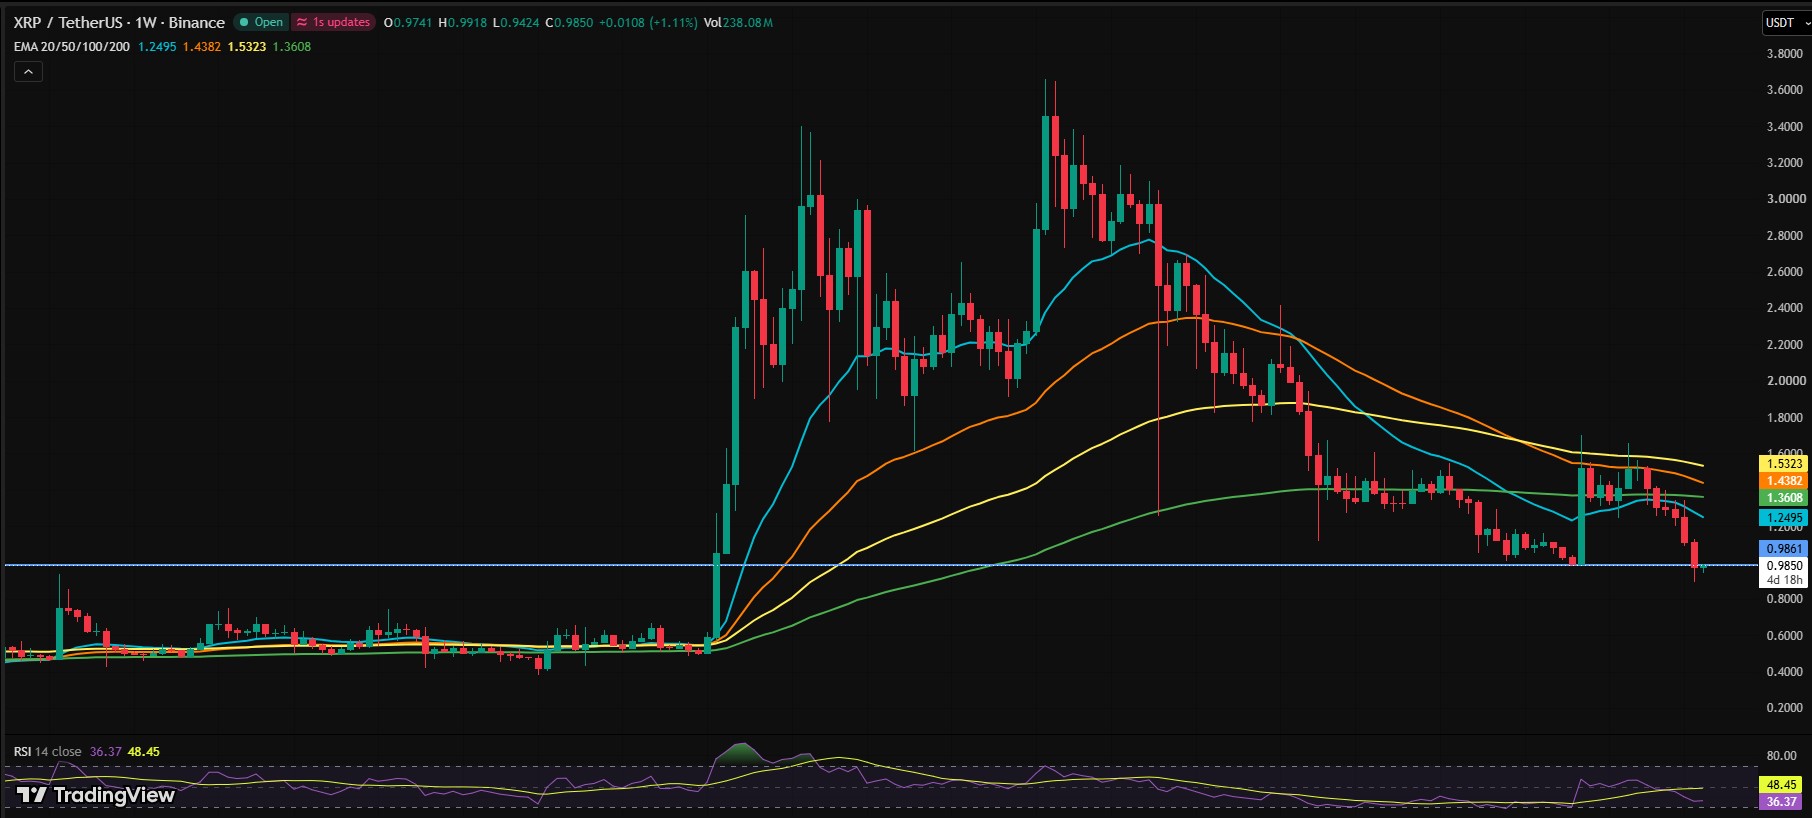
The price is below all four major weekly moving averages. The chart also shows lower highs and lower lows.
Indicator (Weekly) | Value |
Current Price | $0.9850 |
20-Week EMA | $1.2495 |
50-Week EMA | $1.4382 |
100-Week EMA | $1.5323 |
200-Week EMA | $1.3608 |
RSI (14) | 36.37 |
RSI at 36.37 is near oversold. That could allow a short bounce, but it does not confirm a bottom.
Is $0.94 the Next Level to Break?
The weekly low so far is $0.9424. Buyers need to defend the $0.94 to $0.95 zone.
Level | Price Zone | What It Means |
Resistance 2 | $1.25 | Sustained move above needed for a stronger reversal |
Resistance 1 | $1.00 to $1.05 | First area for relief |
Support 1 | $0.94 to $0.95 | Critical zone |
Support 2 | $0.85 | Next target if support fails |
Support 3 | $0.80 | Deeper downside level |
Futures and Sentiment Stay Mixed
Open interest rose 2.20% to $2.02 billion. Futures volume fell 1.82% to $2.27 billion.
Liquidations hit $4.33 million in 24 hours. Longs lost $2.18 million and shorts lost $2.15 million.
The Fear & Greed Index reads 11, extreme fear. It was 59 one month ago.
ETF Flows and Whale Activity
Spot ETFs tied to the token hold $1.08 billion in net assets, or 1.75% of market cap. Daily net flow on November 17 was negative $6.14 million.
Whales moved about 281M coins, worth roughly $270 million, into two new wallets. Neither is tagged as an exchange address, so it does not look like selling.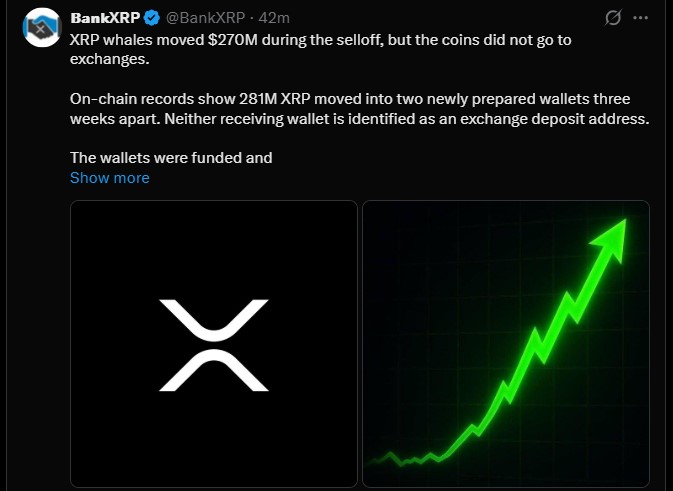
Analyst ChartNerd also noted that the "days at a loss" metric hit zero. Similar readings came in 2017, 2020, 2022 and 2024.
XRP Price Prediction: Possible Paths From Here
Scenario | Trigger | Possible Target |
Bullish | Hold $0.94 to $0.95, then clear $1.05 | $1.25 |
Neutral | Range holds | $0.94 to $1.05 |
Bearish | Daily or weekly close below $0.94 | $0.85, then $0.80 |
The near-term view stays bearish while the price is under the moving averages. Thin liquidity could make any move faster in either direction.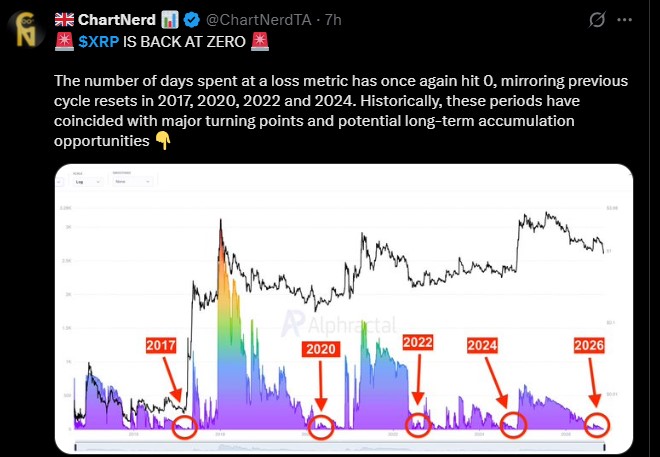
Nobody can say which path will play out. Fear is extreme, which has marked turning points before, but it can also come before more pain.
Disclaimer
This article is for information only. It is not financial, investment or trading advice. Cryptocurrency prices are volatile, and you can lose some or all of your money. Price levels mentioned are not guarantees. Always do your own research and speak with a licensed financial advisor before making any decision.