Zcash Hits New ATH After Fed Hike: Is $ZEC Ready to Explode?

Zcash just had one of its biggest days yet. $ZEC printed a fresh all-time high even after the Fed raised rates, a move that usually hurts risk assets.
At the same time, the largest on-chain ZEC short is underwater by more than $26 million and sitting close to liquidation, while holders just voted on a major network upgrade.
This Zcash price prediction breaks down all three storylines and what the chart shows next.
Market data was checked on September 17, 2026, at 11:21 UTC.
Zcash Price Prediction Today: Market Overview
Metric | Value |
Price | $1,363.26 |
24h Change | +20% |
Market Cap | $22.85B |
FDV | $28.44B |
24h Volume | $2.71B |
Vol/Mkt Cap (24h) | 11.81% |
Total Supply | 16.87M |
Max Supply | 21M |
Circulating Supply | 16.87M |
Source: Data from CoinMarketCap as of September 17, 2026, at 11:21 IST. Figures may vary slightly across other tracking websites.
Zcash Liquidation & Volume Today
Liquidation Data From Coinglass
Timeframe | Total Rekt | Long | Short |
1h | $218.06K | $137.57K | $80.49K |
4h | $3.77M | $463.50K | $3.31M |
12h | $45.87M | $4.86M | $41.01M |
24h | $58.27M | $6.17M | $52.10M |
Short liquidations dominate the 12h and 24h windows, lining up with the rally that's squeezing shorts, including the large underwater position covered below.
Futures Volume by Exchange (Coinglass)
Binance leads $ZEC futures volume at $4.67B, followed by OKX at $3.11B. Hyperliquid ($1.01B), Bybit ($951.86M), and MEXC ($711.03M) round out the next tier.
Zcash News: $ZEC Hits ATH Despite Rate Hike
Another post pointed out that $ZEC hit an all-time high the same day the Clarity Act reportedly failed and the Fed raised interest rates, both typically bearish for risk assets, calling it proof that "ZEC refuses to stop ripping." 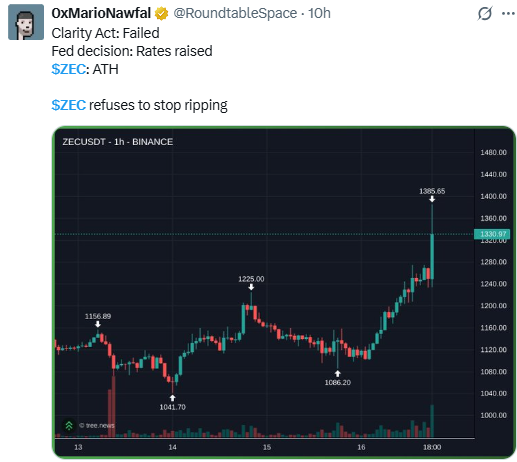
Source: Data From X
Largest $ZEC Short Down $26M and Nearing Liquidation
A separate report tracked the largest on-chain $ZEC short position, now underwater by more than $26 million after the trader added to it 11 hours earlier.
The position reportedly holds 37,760 $ZEC (about $51.5 million) with a liquidation price of $2,631.53. 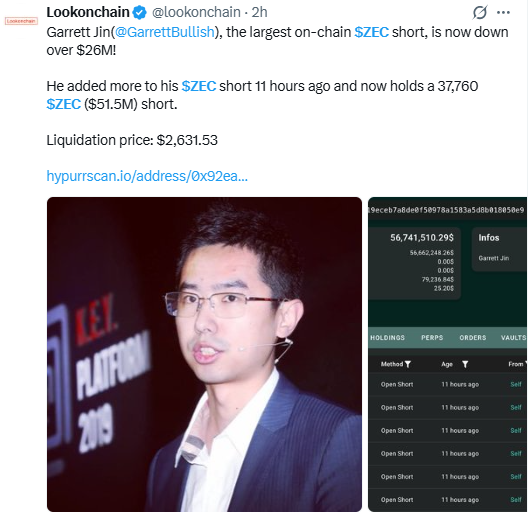
Source: Data From Social Media on X
Note: CoinGabbar could not independently verify the wallet figures beyond what's shown in the report.
Zcash News Today: Holders Vote to Cut Block Time in NU7
In today's crypto news, a report said $ZEC holders voted to cut block time to 25 seconds while keeping the existing halving schedule intact.
Nearly 2.4 million $ZEC took part in the NU7 vote, with 99.9% backing 25-second blocks over 75 seconds and 98.9% supporting the current halving schedule.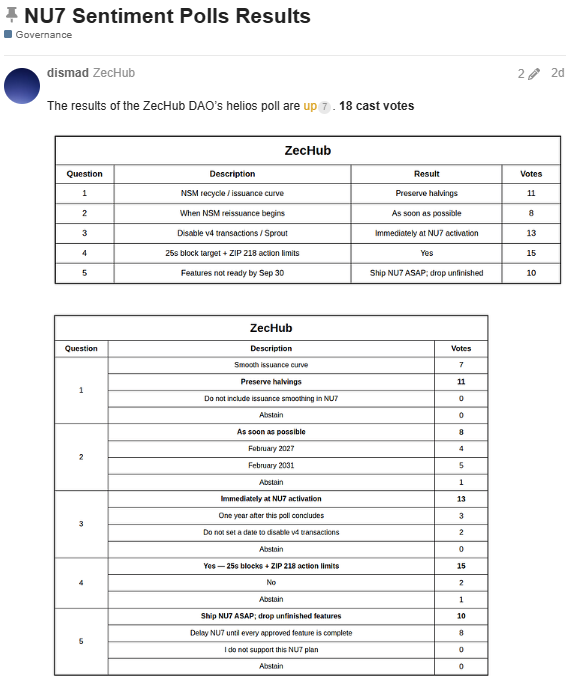
ZEC Technical Analysis: Price Chart and EMA Levels
Pair: ZEC/USD · Market: Spot (Crypto) · Timeframe: 4H · Source: TradingView · Timestamp: September 17, 2026, 01:39 UTC-3
ZEC is trading at $1,363.26, pulling back slightly after a sharp rally that broke well above its EMAs.
The ZEC EMA levels sit far below the current price, with the EMA 20 at $1,217.73 and the EMA 50 at $1,162.83, both well under where the price is trading now.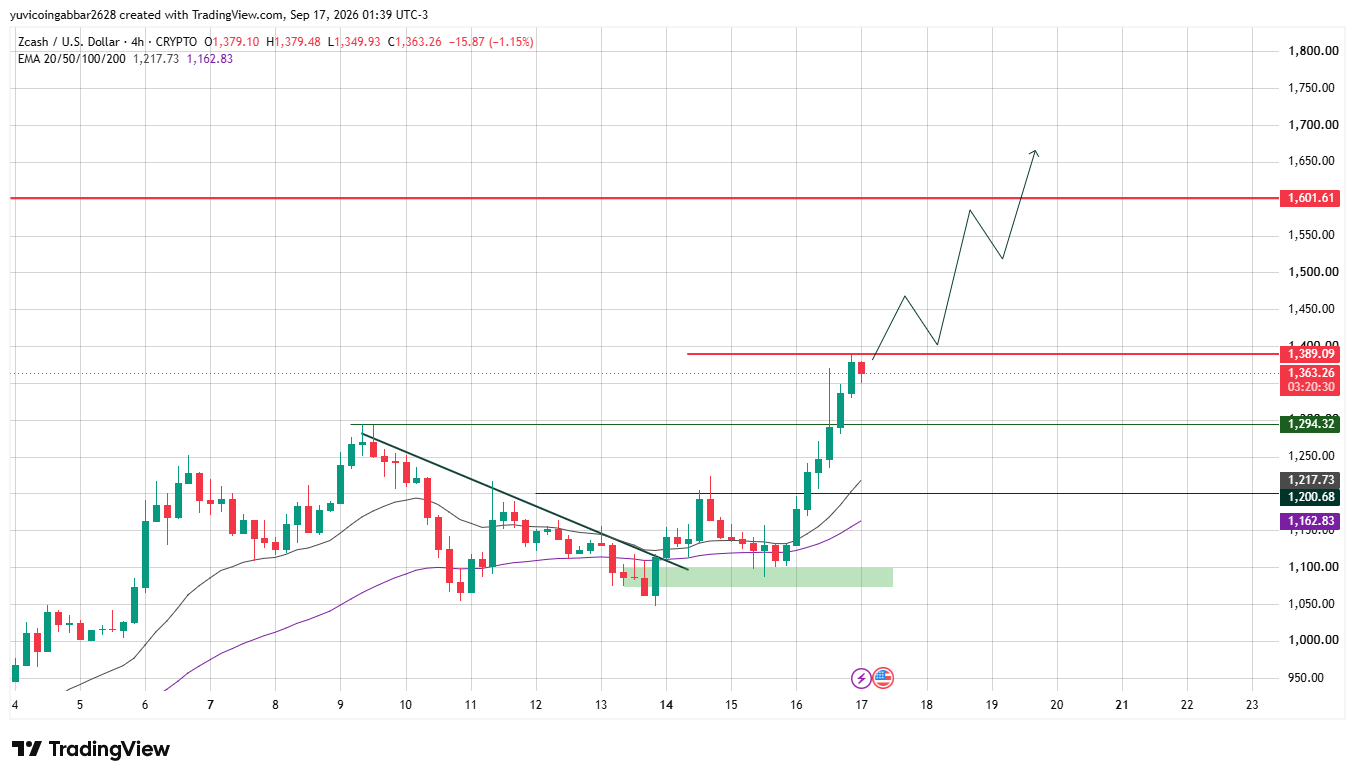
$ZEC Support and Resistance Levels: Zcash Outlook
Level Type | Price |
Resistance 2 | $1,601.61 |
Resistance 1 (nearest) | $1,389.09 |
Immediate Price Reference | $1,363.26 |
Support 1 | $1,294.32 |
EMA 20 | $1,217.73 |
Structural Support | $1,200.68 |
EMA 50 | $1,162.83 |
Zcash Forecast: Bull Case vs Bear Case
Bull case: Holding above $1,294.32 keeps the rally structure intact, and a break back above $1,389.09 would open the path toward $1,601.61, especially if short covering from the large underwater position adds fuel.
Bear case: A deeper pullback below $1,294.32 would bring the EMA cluster near $1,162.83 to $1,217.73 back into play, and losing that zone would put the recent breakout at risk.
Triggers & Invalidation
Scenario | Trigger | Likely Outcome | Invalidation Point |
Continuation | Holds above $1,294.32 | Push toward $1,389.09, then $1,601.61 | Close below $1,294.32 |
Pullback | Loses $1,294.32 | Retest of the $1,162.83–$1,217.73 EMA cluster | Reclaim above $1,294.32 |
Deeper correction | Loses the EMA cluster | Test of $1,200.68 support | Structural support lost |
Zcash Price Prediction: Can $ZEC Reach $1,601.61?
$1,601.61 is the highest resistance level marked on the chart.
Reaching it would require ZEC to first clear $1,389.09, the recent high zone, in a market that's already up double digits today, so the move would need fresh buying rather than just momentum from the current rally.
Zcash Price Prediction 2026: Expert View
According to CoinGabbar analysts, The combination of a rate hike, a failed Clarity Act vote, and a still-rallying $ZEC price is an unusual setup, and the underwater short position adds another layer:
if the price keeps climbing, forced buying from that position alone could add pressure to the upside.
The $1,294.32 level is what separates a healthy pullback from a deeper correction.
Disclaimer
This piece is for informational purposes only and isn't financial advice. The levels and scenarios above are based on technical chart analysis and publicly available data at the time of writing, and crypto markets can move sharply within hours, so past patterns don't guarantee future outcomes. It's worth doing independent research and considering your own risk tolerance before acting on any of the levels discussed here.













.jpg)




