Aethir Price Prediction: Can ATH Hold Gains After Its AI Rally?

What happens when a quiet AI token wakes up in a single session? Aethir (ATH) answered that on October 23, 2026, and every Aethir price prediction now hinges on whether the bounce holds.
Among the latest crypto price predictions, this one deserves a slow read. The chart, the holder data, and the news flow all point in different directions.
Aethir Price Today: Market Data Snapshot
| Metric | Value |
| Current price | $0.006633 |
| 24-hour change | +12.0% |
| Rank | 234 |
| Market cap | $131.674M |
| Fully diluted valuation | $274.747M |
| Circulating supply | 20.129B |
| Outstanding supply | 23.91B |
Source: Data taken from CoinGecko
Aethir Coin News: AI Compute Capacity Update
Aethir is a decentralized cloud network that rents out GPU power, the chips behind AI, so businesses can borrow computing muscle instead of buying servers.
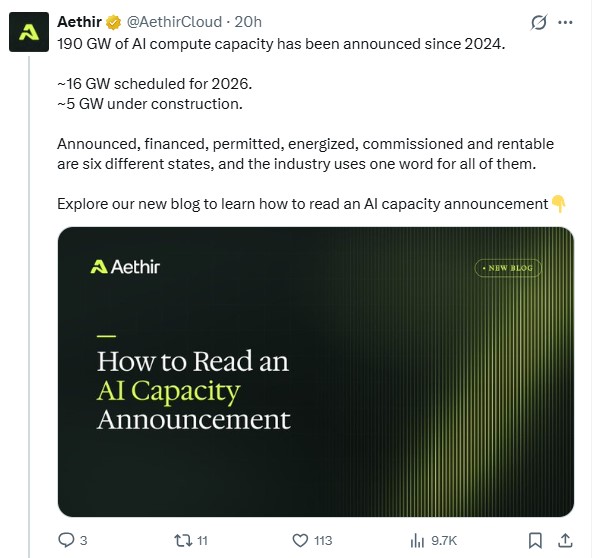
On the Aethir announcement on X, the team shared that 190 GW of AI compute capacity has been announced since 2024. GW means gigawatt, a unit of power, and about 16 GW is scheduled for 2026.
But an announcement isn't the same as a build. Announced, financed, permitted, energized, commissioned, and rentable are six different states, and the industry uses one word for all of them.
And that gap matters for the Aethir coin.
Aethir Holder Distribution and Whale Concentration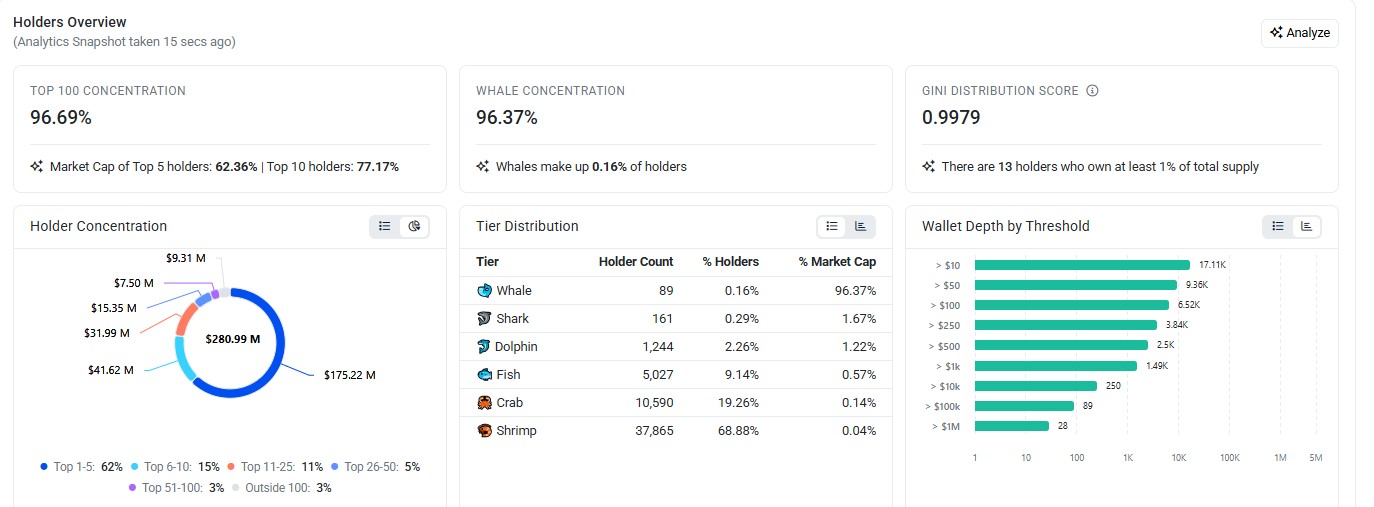
Holder data tells a heavier story, since the top 100 wallets control 96.69% of tracked supply, and whale concentration sits at 96.37%. Only 89 wallets count as whales, yet that tier owns nearly everything, which anyone can cross-check on the Etherscan token page.
Another 13 wallets each hold at least 1% of the total supply, and the Gini score reads 0.9979. One whale selling could move this chart. Meanwhile, 37,865 shrimp wallets make up 68.88% of holders but just 0.04% of market cap.
ATH Trading Volume: Exchange Heatmap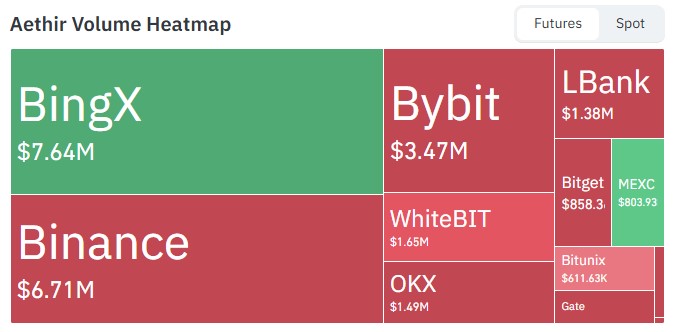
Source: Data taken from CoinGlass
Futures volume shows where leveraged traders are busy, with BingX leading at $7.64M and Binance next at $6.71M. Bybit adds $3.47M, WhiteBIT $1.65M, OKX $1.49M, and LBank $1.38M.
BingX and Binance alone hold roughly 58% of the volume shown, which is why crypto exchange listings matter for liquidity.
Aethir vs Render: AI Crypto Coins Compared
Render (RENDER) is the closest peer to Aethir, since both tokens power networks that rent out GPU computing for AI work. At the time of writing on October 23, 2026, Render trades at $1.79 with a $928.553M market cap, while Aethir sits at $131.674M, roughly one-seventh of that.
But Aethir is moving faster, up 12.0% in 24 hours while Render slipped 1.5%, and its daily volume equals about 11.3% of market cap against 5.6%.
AI Crypto Coins: Where Aethir Fits
Most AI crypto coins fall into a few groups, and Aethir sits in the compute rental bucket. Render shares that bucket, while others focus on data sharing, trained models, or autonomous software agents.
Regular AI crypto news tracks most of these groups, and compute is the easiest story to measure, since servers get rented.
But narratives move faster than usage. The 190 GW headline shows ambition, and ATH is weaker on holder spread yet stronger on momentum, so revenue will decide whether it's real.
Aethir Technical Analysis: 4-Hour Chart Breakdown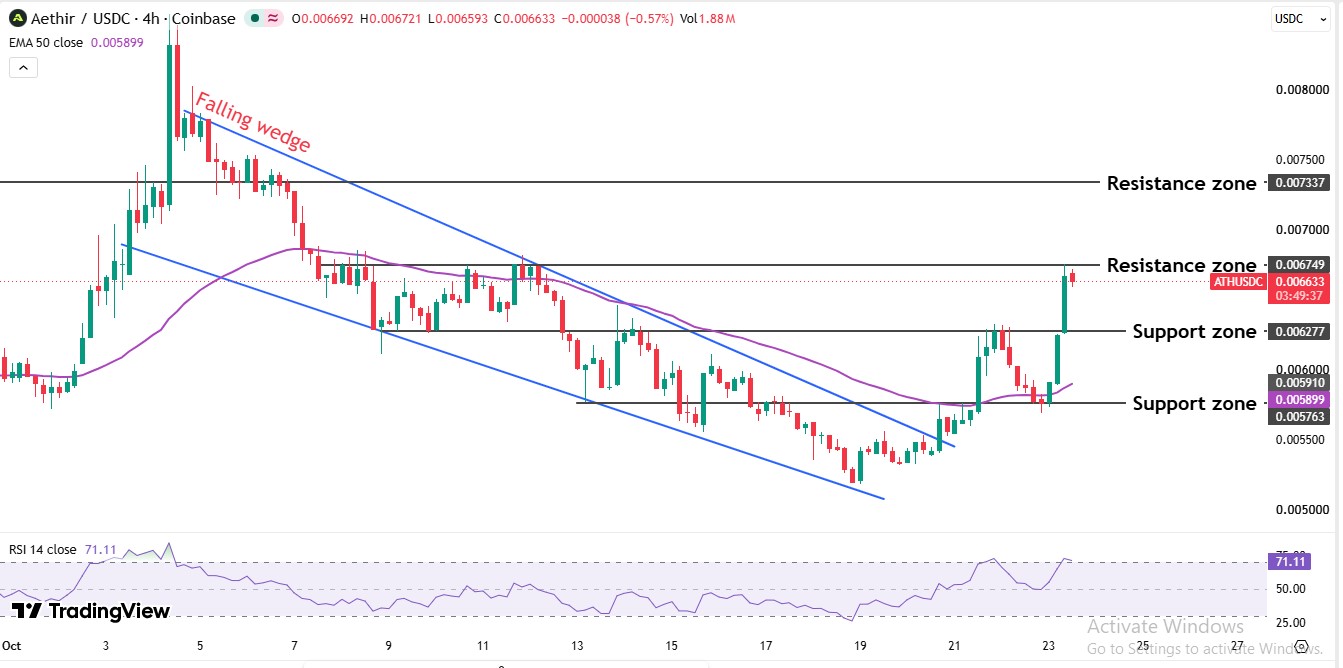
Aethir technical analysis starts with slowing creating the falling wedge on the 4-hour chart, and wedge breakouts show up on plenty of altcoin charts. ATH spiked above $0.008 in early October, then slid for about two weeks.
That slide formed a falling wedge, with lower highs and lower lows inside narrowing lines, and it bottomed near $0.005190 around October 19. Sellers ran out of steam, and the price broke the upper line around October 21.
After the break, the price dipped back to the $0.005763 area beside the 50-period EMA at $0.005899. Buyers defended it, and $ATH jumped through $0.006277 up to $0.006749.
And then there's RSI, reading 71.11, and above 70 usually means stretched. since a reading this high often needs a breather first.
ATH Support and Resistance Levels: Key Price Zones
Support is where buyers step in, and resistance is where sellers appear. The table below maps both zones around the current ATH price.
| Zone | Price | Role |
| Resistance 2 | $0.007337 | Next upside target |
| Resistance 1 | $0.006749 | Tested already, sellers reacted |
| Support 1 | $0.006277 | Breakout hold level |
| Support 2 | $0.005899 | 50-period EMA |
Aethir Price Prediction: Bullish, Base, and Bearish Cases
In the bullish case, buyers stay in control if ATH holds above $0.006277 and breaks $0.006749 with real volume. That opens a path toward $0.007337, the next resistance zone on the chart.
The base case is a pullback first. Price retests support near $0.006277, letting the RSI cool off and then chop between that level and $0.006749.
In the bearish case, losing $0.006277 would turn the breakout into a trap. Sellers could then push toward $0.005910 and $0.005763, especially with whales holding nearly everything.
| Scenario | Trigger | Invalidation |
| Bullish | Hold above $0.006277, then break $0.006749 | Breakdown below $0.006277 |
| Base case | Pullback, then a retest of support | Breakdown below $0.005910 or a strong break above $0.006749 |
| Bearish | Breakdown below $0.006277 | Price reclaims $0.006277 and pushes above $0.006749 |
Aethir Price Prediction: Expert Outlook
As per the CoinGabber analysis, bullish bias holds for now, since the wedge breakout, rising volume, and price above the 50-period EMA all point the same way. But RSI at 71.11 says the sprint was steep.
A retest of $0.006277 that holds would strengthen the case, since buyers defending an old resistance zone is a healthy sign. Volume confirmation matters too, because a break above $0.006749 on thin trading often fades.
This ATH price prediction leans cautiously bullish, with the base case favoring a retest before any new push. The ATH price forecast stays constructive while $0.006277 holds.
Disclaimer: This content is for information only and isn't financial advice. Crypto assets are volatile, and prices can move sharply in either direction. Readers should research independently and consider personal risk before trading.

















