AKEDO Price Prediction Today: Can Bulls Break $0.037 Resistance?


Why would a token that sank for weeks suddenly jump while Bitcoin goes nowhere?
Traders keep asking. Some call it a trap, others call it a reset, and last month's AKEDO price prediction sparked the same argument.
So who's driving it, and who's betting against it?
$AKE Price Today: Market Snapshot
Oct 23, 2026, about 11:20 UTC, via CoinMarketCap market data.
Metric | Reading |
Price | $0.03377 |
24H change | +15.86% |
30D change (CoinGlass) | -33.78% |
Market cap | $767.25M |
24H spot volume | $40.67M (-5.78%) |
Circulating supply | 22.79B of 100B AKE |
Rank 212 and a $767.25M AKEDO market cap make this a small-cap token.
Spot volume fell 5.78%. Even as the price jumped 15.86%.
Why Is $AKE Up Today?
$AKE is up 15.86% in 24 hours. BTC slipped 0.34% to $81,521.88, and its volume dropped 33.49%.
That's a clean divergence. Flow seems to be setting the pace.
AI-gaming tokens often trade on their own cycle, a theme covered in AI crypto news.
Daily Candle vs. Rolling 24 Hours
Two numbers float around: +7.36% on the TradingView daily chart and +15.86% on CoinMarketCap.
Midnight UTC sets the daily open at $0.0314010, and the rolling window starts earlier, so it catches an extra leg higher.
AKEDO Price Prediction: Technical Analysis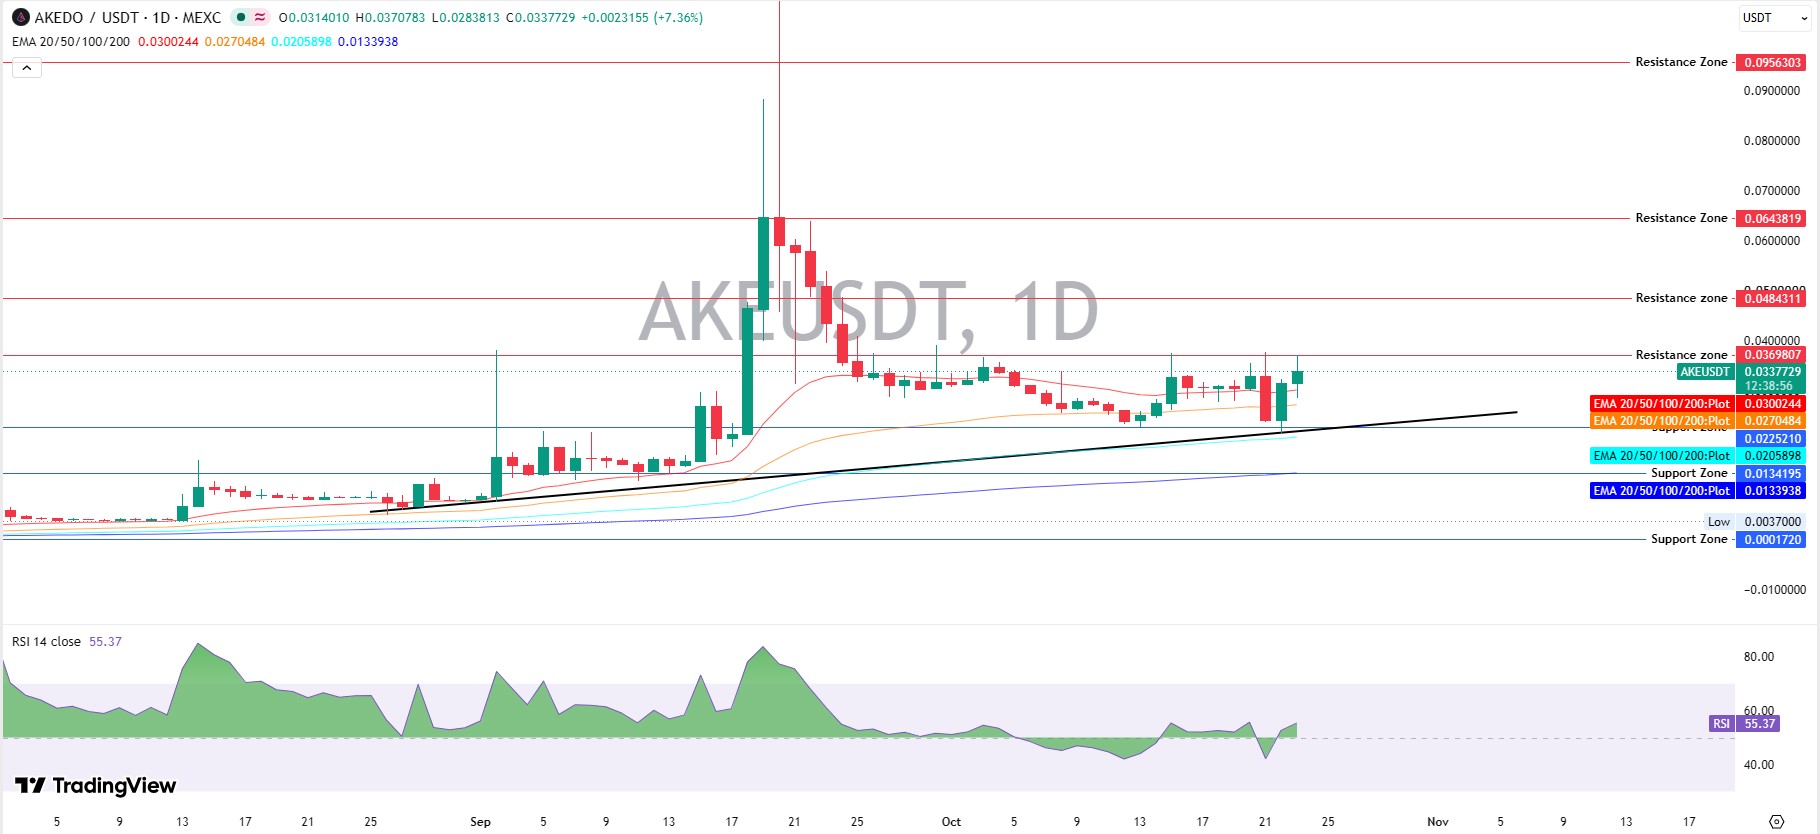
EMA Structure
Any AKE price analysis starts with the EMA, or exponential moving average, which weights recent trades more.
$AKE trades above all four on the daily chart: $0.0300244 (20 EMA), $0.0270484 (50 EMA), $0.0205898 (100 EMA), and $0.0133938 (200 EMA).
That stack runs in perfect order, the same climb the earlier AKE momentum analysis tracked.
And the price sits 12.5% above the 20 EMA, so a dip toward $0.0300 wouldn't wreck the structure.
RSI is 55.37; momentum leans bullish with room before 70. But it isn't explosive either.
The AKEDO technical analysis turns on a rising trendline from late August.
Then came the wick on the Oct 22, 2026, candle. A long one, tagging the trendline near $0.0225.
That felt like a warning at first. Actually, no. It was a defense, and buyers won it. Any AKEDO price prediction has to respect that.
Futures vs. Spot: Who Is Trading AKE?
Futures are contracts that let traders bet on direction with borrowed funds.
AKE derivatives data shows $661.15M in 24-hour futures volume against $15.84M in spot, roughly 42 times more.
Open interest, the value of open positions, sits at $84.47M, about 11% of market cap.
Binance futures volume jumped 51.27%, while $AKE trading volume on spot slipped 5.78% per CoinMarketCap.
So can a move this derivatives-heavy hold without spot buyers stepping in?
Long-Short Ratios and Liquidations
A long-short ratio below 1 means more shorts than longs. Binance accounts read 0.9763, OKX reads 0.61, and Binance top traders sit at 0.8274 by position size.
Bigger accounts lean short. Much more than the crowd. Fuel if resistance breaks. A warning if it doesn't.
In a short squeeze, rising price forces short sellers to buy back, pushing price higher still. But calling this an AKE short squeeze overstates it.
Shorts lost $893.83K of the $1.59M liquidated in 24 hours, about 56%.
Against $84.47M in open interest, that's tiny. Wider altcoin flows are tracked in the latest crypto news.
Whale Map on BNB Chain
BscScan holder data lists 40,936 holders, yet the top five wallets control 31.24% of supply.
The top 10 hold 45.56%, and the top 100 own 86.86%. One unlabeled wallet alone holds 13.37%.
But some may be vesting, exchange, or contract addresses, so concentration doesn't automatically mean selling.
AKE Support and Resistance Levels
Eight AKE support and resistance levels frame the next move. Peers sit in the crypto price predictions hub.
Level | Type | Note |
$0.0956 | Resistance | Upper zone |
$0.0644 | Resistance | Second target |
$0.0484 | Resistance | First target |
$0.0370 | Resistance | Ceiling tagged today |
$0.0300 | Support | EMA 20 |
$0.0270 | Support | EMA 50 |
$0.0225 | Support | Near trendline |
$0.0134 | Support | Near EMA 200 |
AKE Price Prediction Scenarios
This AKEDO price prediction covers the next 7 to 14 days from Oct 23, 2026, about 11:20 UTC. The long-range AKEDO forecast covers the wider horizon.
Scenario | Trigger | Target | Invalidation | Liquidity condition |
Bull | Holds above $0.0370 | $0.0484, then $0.0644 | Back below $0.0300 | Spot volume rises, 42x futures gap narrows |
Base | Range $0.0300 to $0.0370 | Same range | Edge breaks on volume | Futures-led, small liquidations |
Bear | Trades below $0.0300 | $0.0270, then $0.0225 | Back above $0.0337 | Thin depth (0.55% of market cap) speeds drop |
Bull Case
A hold above $0.0370 flips the ceiling into a floor. That opens the first AKE price target at $0.0484, about 43% higher, then $0.0644.
And each leg needs spot buyers, not just futures noise.
Base Case
Range trading between $0.0300 and $0.0370 is the working assumption of this AKEDO price forecast.
Bear Case
Trades below $0.0300 would erase EMA 20 support and point toward $0.0270, about 20% lower. Beneath it sits $0.0225, roughly 33% lower.
Can AKE Reach $0.05?
Traders asking if AKE can reach $0.05 need a 48% climb from $0.0337729.
At 22.79B circulating supply, that implies a $1.14B market cap, roughly $372M above today's level. But $0.0484 comes first. Possible, yes. Easy, no.
Supply Risk: 77.21B AKE Not Yet Circulating
Only 22.79% of the 100B supply circulates today. FDV, or fully diluted valuation, sits at $3.36B, about 4.4 times market cap.
The 77.21B tokens outside circulation are worth roughly $2.6B at current prices. Release dates are trackable on the coin events calendar.
What Traders Should Watch Next
Gaming-token updates collect in GameFi crypto news.
A hold above $0.0370 on rising spot volume
$0.0300 (EMA 20) as first support
Final Takeaway
Bias leans mildly bullish above $0.0300. Conviction waits for a hold above $0.0370.
This AKEDO price prediction treats the jump as promising, not proven.
Disclaimer: This content isn't financial advice. Crypto is volatile, and technical indicators are evidence, not certainty.

















