ARIA Price Prediction: Can ARIA Reclaim $0.22816 Level?


Buyers and sellers are both watching the resistance level at $0.22816 for the next clue.
This ARIA price prediction begins with ARIA trading well below its recent spike high. Traders can compare the setup with earlier ARIA analysis. A support level is a price where buyers have stepped in before. A resistance level is a price where sellers have pushed the price back.
How Is ARIA Holding Up After a 10.47% Daily Drop?
CoinMarketCap data puts ARIA at $0.2273, down 10.47% over 24h. The token ranks 252nd by market cap.
Market cap sits at $99.74M against an FDV of $226.69M. FDV is what the token would be worth if all 1B tokens were already circulating. Only 439.99M circulate today.
Volume fell 20.57% to $14.69M. Is that enough to absorb a 10.47% drop? It seemed thin at first. Maybe not, at 14.5% of market cap.
How Could ARIA Holder Concentration Change This Price Analysis?
BscScan holder data puts the top 100 wallet share at 99.56% of supply.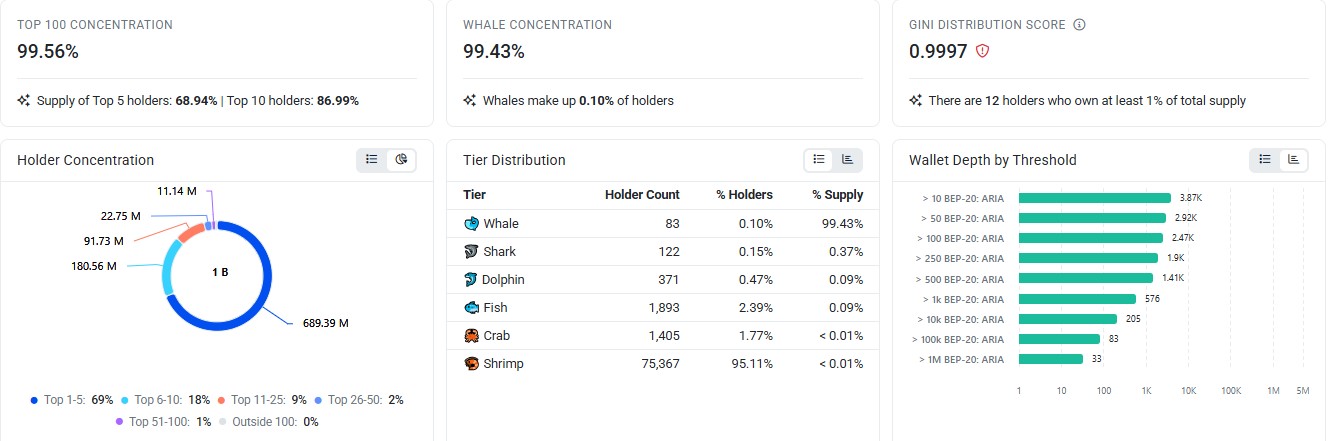
Source: BscScan holder data, ARIA holder concentration, and tier distribution, captured Nov 21, 2026, 04:28 UTC
The top 5 wallets hold 68.94%, and the top 10 hold 86.99%. Whales, wallets with very large balances, number 83. They make up 0.10% of holders but hold 99.43% of supply.
Twelve wallets each hold at least 1% of supply. The Gini score, a gauge of how unevenly tokens are spread, reads 0.9997.
The tracker uses the full 1B supply as its base. The $99.74M market cap rests on 439.99M circulating tokens.
With so few wallets holding nearly all supply, one large transfer to an exchange could add sell pressure fast. The $0.20605 support level would take that test first.
What Does ARIA Liquidation Data Say About Buyers and Sellers?
CoinGlass liquidation data shows $13.03K wiped out in the last hour, mostly shorts. A liquidation is a forced exit from a borrowed-money trade once margin runs out.
Window | Longs | Shorts | Total |
1h | $4.20K | $8.83K | $13.03K |
4h | $4.20K | $14.98K | $19.19K |
12h | $25.35K | $21.45K | $46.81K |
24h | $62.03K | $66.51K | $128.55K |
Source: CoinGlass liquidation data, ARIA liquidations by window, captured Nov 21, 2026, 04:28 UTC
Shorts took most recent losses, and a forced short exit means buying the token back. Traders often read liquidation data beside the latest crypto news to judge whether headlines add pressure.
ARIA Technical Analysis: MACD Levels
The TradingView 4h chart on KuCoin frames this ARIA price prediction for the ARIA/USDT pair. Price spiked to the $0.32173 resistance level, sellers took control, and price fell below the $0.14892 support level before buyers stepped back in.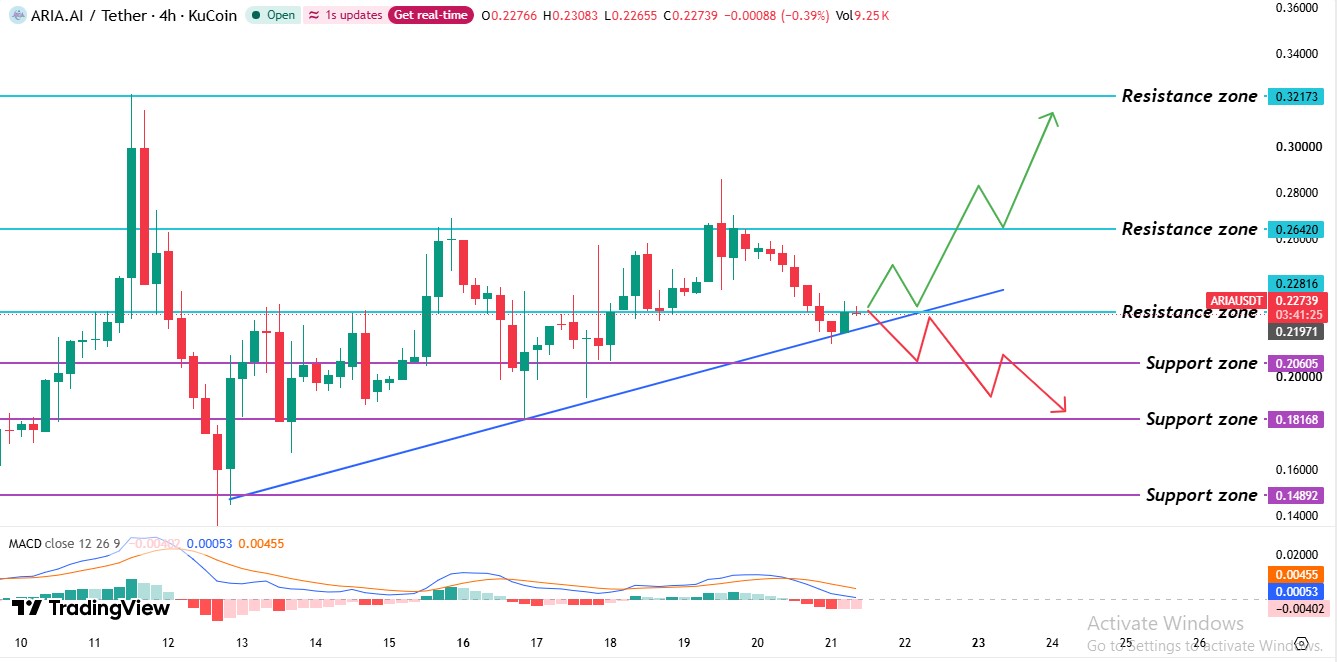
Source: TradingView, ARIA/USDT 4h chart with MACD levels, captured Nov 21, 2026, 04:28 UTC
After the low, buyers lifted the price into a range, a band held between a support level at $0.20605 and a resistance level at $0.26420. The market tried to break $0.26420 twice and failed both times. The second push sent a spike wick, a thin candle tail, above it, but sellers rejected it.
Price then slid back through $0.22816. That level had held as support during the climb, so it's now a resistance level.
The latest 4h candle rebounded from a wick near the rising trendline, a line connecting the recent higher lows. A break below that trendline would show buyers losing control. More targets sit in the ARIA price targets. Right now, the price sits just under the $0.22816 resistance level and well above the $0.20605 support level.
the MACD line reads 0.00053 and the signal line reads 0.00455. Both are above zero, so the bigger move still leans positive.
But the MACD line trades below the signal line, and the histogram, with bars showing the gap between the two, reads -0.00402. Sellers hold the short-term edge.
Support and Resistance Levels
Level | Type |
$0.32173 | Resistance level |
$0.26420 | Resistance level |
$0.22816 | Resistance level |
$0.20605 | Support level |
$0.18168 | Support level |
$0.14892 | Support level |
ARIA Price Forecast: Bull, Base, and Bear Scenarios
Bull: A daily candle above the $0.22816 resistance level opens the way to $0.26420. A daily candle back below $0.22816 cancels it, with rising volume as confirmation.
Base: price stays between the $0.20605 support level and the $0.22816 resistance level. It trades sideways until a daily candle breaks either one, with volume near current levels.
Bear: A daily candle trading below the $0.20605 support level targets $0.18168. A daily candle back above $0.20605 cancels it, and rising liquidations would add pressure.
Concentrated holders could send tokens to exchanges, and the 560M tokens not yet circulating could add supply later.
Expert Outlook on ARIA Price Prediction
According to CoinGabbar analysis, this ARIA price prediction leans cautious. MACD momentum is turning down, volume fell 20.57%, and the price sits under a resistance level it lost.
But the rising trendline is intact. Buyers keep the base case alive while the price holds above support. The level to watch is the resistance level. A daily candle trading above it with rising volume would turn the cautious read into a recovery attempt.
Disclaimer: This article is for information only and isn't financial advice. Traders should do their own research and risk only what they can afford to lose.