AriaAI Price Prediction: Can ARIA Surprise the Market?


AriaAI has spent weeks carving out an ascending channel and then briefly broke above its own upper boundary this week before snapping straight back inside it.
That can look like the start of something bigger, or exactly what a fake breakout looks like in real time.
Any grounded AriaAI price prediction has to sit with that ambiguity first.
How Is AriaAI's Market Valuation Shaping Up?
ARIA is trading near $0.0359, up about 8.83% over 24 hours, according to CoinMarketCap data.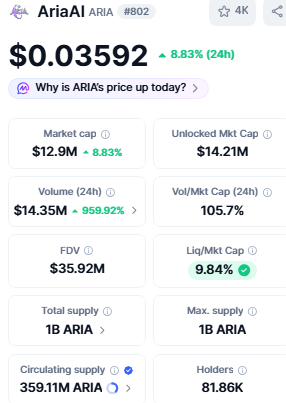
Market cap sits near $12.9 million against a fully diluted valuation of $35.92 million, with circulating supply at 359.11 million ARIA out of a fixed 1 billion total, just over a third in circulation.
24-hour volume has jumped to $14.35 million, up nearly 960% on the day and now larger than the market cap itself, a turnover level unusual enough to belong in any serious AriaAI price prediction.
Is the Market Backing This Move With Real Positioning?
Derivative data tells a mixed story. According to Coinglass data, ARIA is up 6.96% over 24 hours but nearly flat over seven days at 0.64%, while the 30-day gain stands at a sharp 39.29%, mostly built earlier in the month.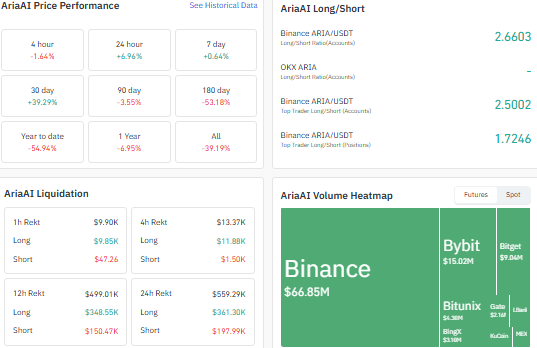
Binance's long/short ratio for top traders sits above 2.5, tilted heavily long.
That skew came at a cost: 24-hour liquidations totaled about $559,000, with longs absorbing the larger share near $361,000, consistent with the failed breakout, while futures volume stays heavily concentrated on Binance.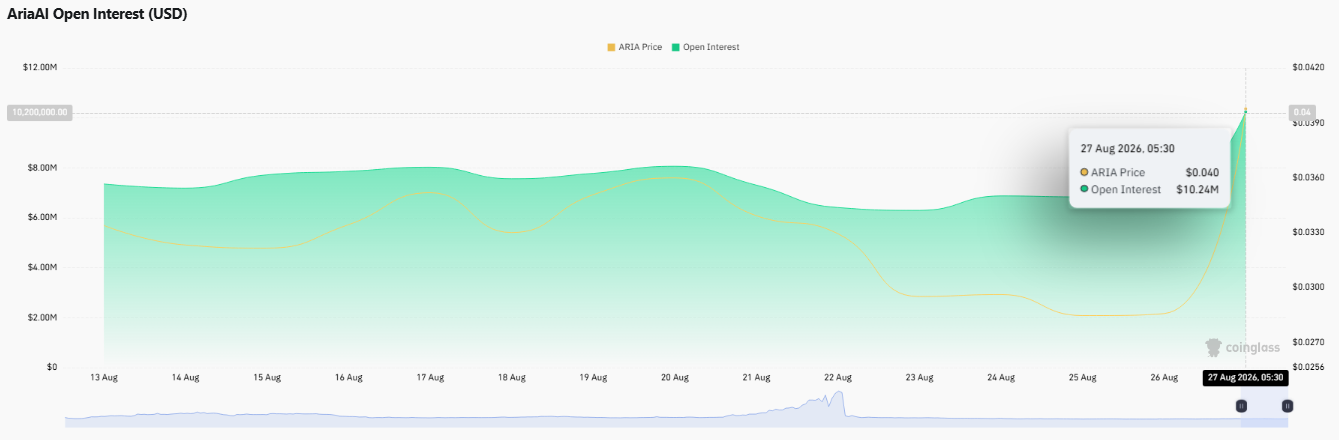
Open interest has surged to roughly $10.24 million from about $2 million just days earlier, and
How Concentrated Is ARIA's Token Supply?
Holder data adds a caveat to this AriaAI price prediction. Per BscScan holder data, the top 5 wallets hold about 73.37% of supply, and the top 10 hold 85.23%, with a Gini score of 0.9992, near maximum concentration.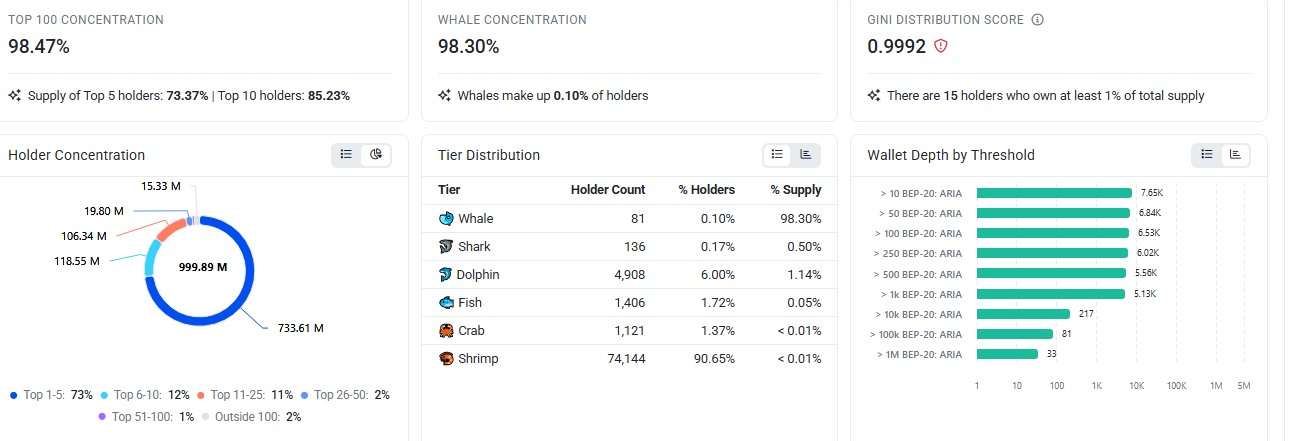
Just 81 whale wallets control roughly 98.30% of circulating supply, while over 74,000 smaller wallets combined hold under 1%, a structural risk sitting outside the chart.
What Could Happen Next for ARIA?
Before getting to ARIA's daily chart, here is how different AriaAI price prediction scenarios could play out from here.
| Outlook | Trigger | Key Levels |
| Bullish | Daily close holds above channel resistance | 0.04702 -> 0.05836 -> 0.07828 |
| Neutral | The price stays inside the recent channel | 0.03265 - 0.04702 |
| Bearish | The daily close breaks back below support | 0.03265 -> 0.02209 |
Can ARIA's Daily Chart Confirm Its Channel Breakout?
The clearest read comes from the daily chart. ARIA has traded inside an ascending channel for weeks, a different structure from the falling patterns seen elsewhere right now.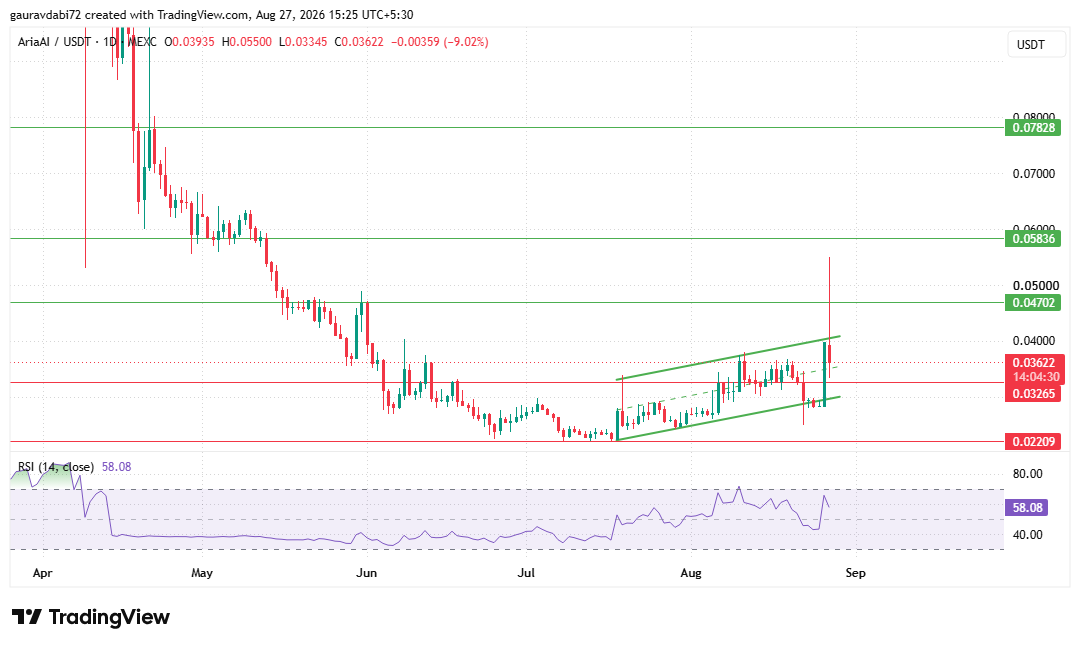
A large green candle pushed price above the channel's upper boundary, but the very next session reversed hard and pulled it back inside, a fake breakout rather than a confirmed one.
Per the TradingView chart, the setup stays wait-and-watch until a daily close holds above that trendline.
If confirmed, resistance at 0.04702, 0.05836, and 0.07828 comes into view; failing that, support sits at 0.03265 and then 0.02209.
The 14-day RSI reads 58.08, neutral to mildly bullish, showing momentum has cooled without turning bearish.
Analyst View
As per the CoinGabbar analyst, ARIA's setup right now leans more cautious than bullish.
The failed breakout above the ascending channel, followed by an immediate reversal back inside it, is a classic sign of exhausted buying pressure rather than genuine trend continuation.
That's reinforced by the derivatives side, where longs took the bulk of the $559,000 in 24-hour liquidations, showing leveraged buyers got caught on the wrong side of the reversal.
Layered on top of that is the token's extreme holder concentration, with just 81 whale wallets controlling nearly 98.30% of circulating supply, a structural factor that can drive sharp, low-notice price swings independent of chart patterns.
Taken together, these three signals point to a wait-and-watch phase, where only a confirmed daily close above the channel's upper boundary would meaningfully shift the setup.
Disclaimer: This article is for informational purposes only and does not constitute financial, investment, or trading advice. Cryptocurrency markets are highly volatile and unpredictable; readers should conduct their own research before making any decisions. CoinGabbar and the author bear no responsibility for losses incurred based on this content.
Also read:

















