ASTER Token Surge: $0.70 Spike Vanishes in Minutes as Price Reverses


ASTER Token Surge: Why Did the $0.70 Price Spike Collapse So Quickly?
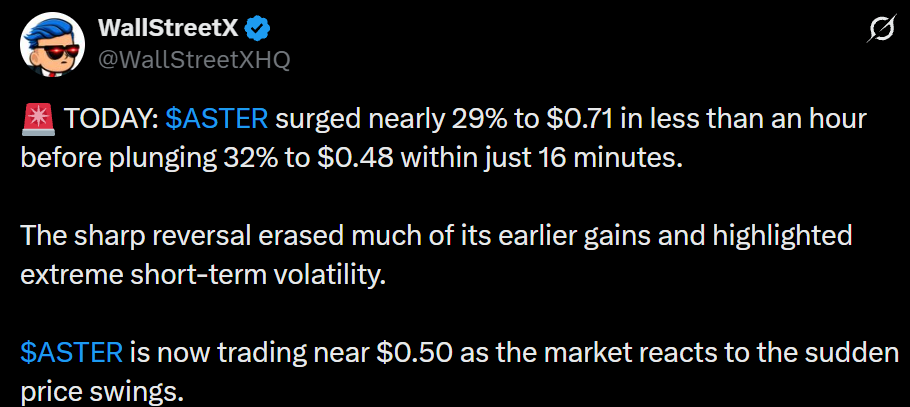
A sudden ASTER token surge caught traders off guard in the early hours of 16 November.
The price rose by roughly a third in a short time, touched about $0.70, and then dropped back below $0.50 almost as quickly.
This article covers only what the live market data and the project’s official website confirm. It explains the numbers in simple words and says clearly what is not yet confirmed.
Source: Post on X
What Happened on the Price Chart
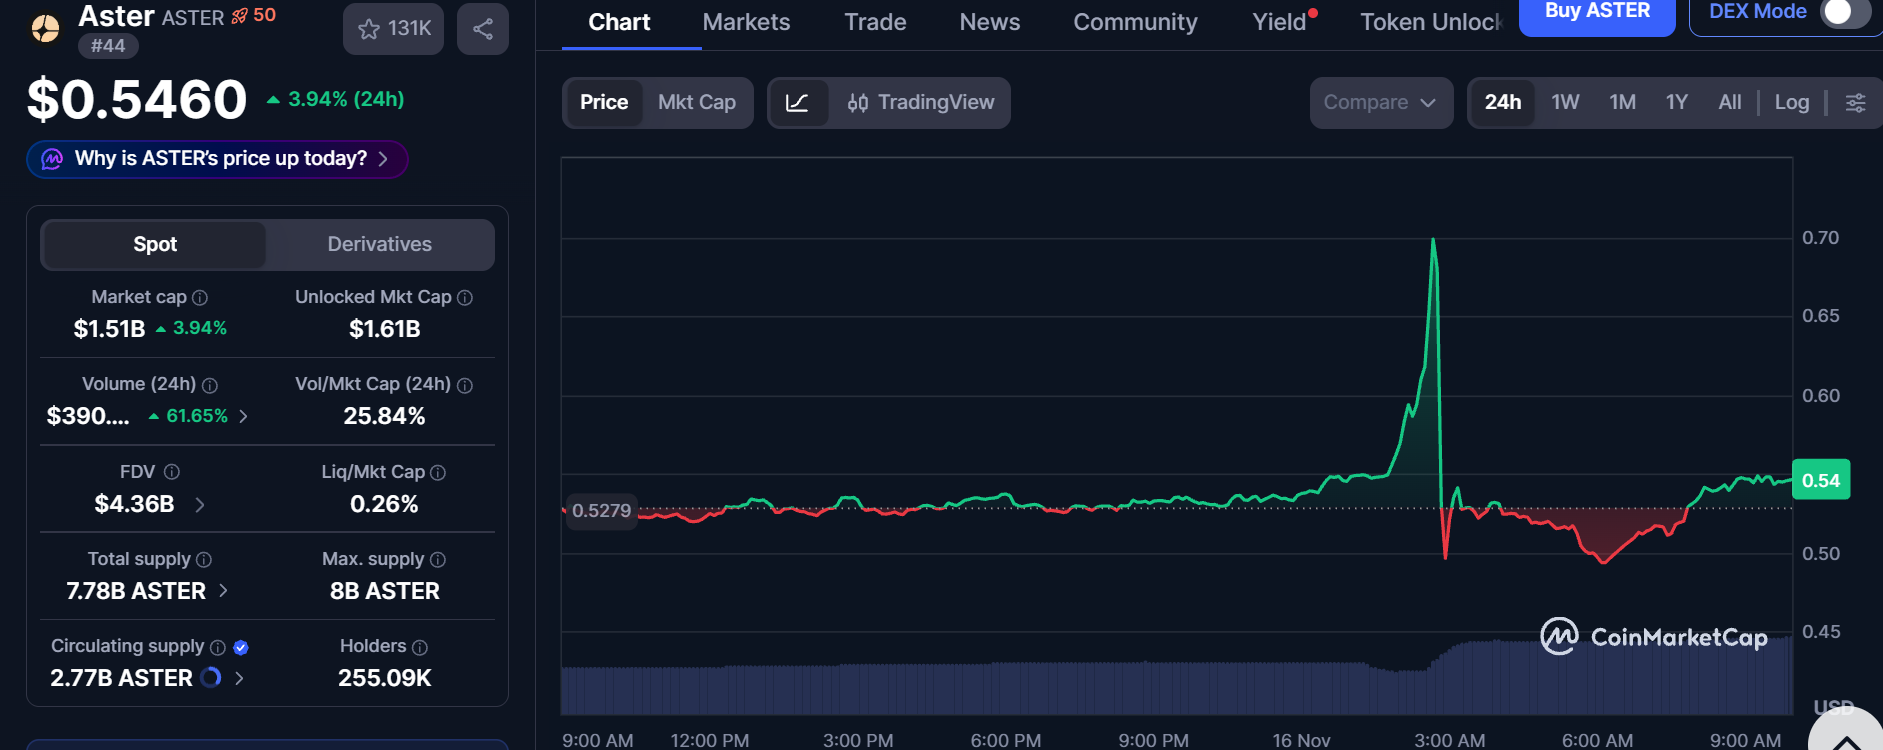
On the CoinMarketCap live page, the 24-hour chart starts at $0.5279 and moves sideways around $0.53 for most of the day.
Around 3:00 AM IST on 16 November, the price shot up to about $0.70. Within minutes it fell back to just under $0.50.
The shape on the chart is a narrow needle: the line goes almost straight up and then almost straight down.
The price dipped slightly again in the following hours, then recovered, and it stood at $0.5460 in the morning, up 3.94% over 24 hours.
Any report on the ASTER token surge should stress that the spike was brief. The price ended the day only a little above where it started.
The Numbers Behind the Move
The table below uses the live data from the same page, read on the morning of 16 November.
Metric | Value | In simple words |
Price | $0.5460 | Up 3.94% in 24 hours |
Starting price (24 hours ago) | $0.5279 | Where the day’s chart begins |
Highest point of the spike | About $0.70 | Read from the chart |
Market value | $1.51B | Price multiplied by coins in circulation |
24-hour trading | About $390M | Up 61.65% |
Trading vs. market value | 25.84% | About a quarter of the coin’s value changed hands in a day |
Source: CoinMarketCap live page
Three details stand out:
Heavy trading: volume rose by more than 60%, which fits a day of intense activity.
Limited supply in circulation: only 2.77 billion of the 8 billion maximum coins, about 35%, are available in the market.
Low liquidity ratio: the same page shows 0.26%. A small figure like this often points to thin buying and selling depth, which makes big orders more likely to push the price sharply.
How Leverage Can Cause Sudden Swings
The project’s official website describes it as a decentralized exchange built for perpetual contracts.
The site currently lists $2.32B in open positions and $1.46B in total value locked.
Three simple ideas explain how fast moves can happen on platforms like this:
Perpetual contract: a trade that lets someone bet on a price rising or falling without owning the coin.
Leverage: borrowed money that makes a trade bigger. Gains grow, and so do losses.
Liquidation: an automatic forced closing of a trade when losses use up the trader’s deposit.
When many leveraged trades close at once, the forced buying or selling can push the price further and trigger more closings.
This chain reaction can create sharp spikes and drops within minutes. It is a general explanation of how such moves can happen. It is not a confirmed cause of this specific one.
What Is Not Confirmed Yet
The data above shows what the price did, but it does not show why. No explanation from the project has been verified for this article, so the cause of the ASTER token surge should be treated as unconfirmed.
Several questions remain open:
What triggered the sudden jump
Whether a few large trades or many small ones drove it
Whether the project will publish its own explanation
Whether similar swings could repeat
Readers who want an official answer should follow the project’s official X account and website for updates.
What Readers Can Check Themselves
Even without a confirmed cause, anyone can read the market signals directly:
Live price: check the current figure on the CoinMarketCap page before making any decision, because it changes constantly.
Trading vs. market value: a high ratio, like today’s 25.84%, shows heavy activity and often comes with bigger price swings.
Supply: with about 35% of the maximum coins in circulation, future supply changes can matter for the price.
Official updates: wait for statements from the project itself rather than screenshots or rumors on social media.
Conclusion
The ASTER token surge lasted only minutes, and the price is now close to where the day began.
The verified data shows heavy trading, a low liquidity ratio and a small share of coins in circulation, which together help explain why the move was so sharp.
The reason behind it is still unconfirmed, so readers should wait for an official explanation and always check the live price before making decisions.
Disclaimer
This article is for educational and informational purposes only and is not financial or investment advice. Crypto assets are high risk, their prices can be very volatile, and you can lose some or all of your money. Always do your own research and consider speaking with a licensed financial advisor before making investment decisions.






