Bitcoin at $77K: Will $76K Hold or Is $73K Next After Binance Hack?


Bitcoin is trading near $77,251, down 1.27% in 24 hours, and the next move hinges on one level. The coin briefly hit about $76.4K after Binance reported a $6.3 billion security breach.
Santiment says roughly $1.5 billion in leveraged positions were liquidated. October is now down 7.50%, so "Uptober" is shaping up as "Rektober."
The question is simple. Does $76K hold, or does BTC slide toward $73K?
$76K Support Faces Its Biggest Test Since the Hack
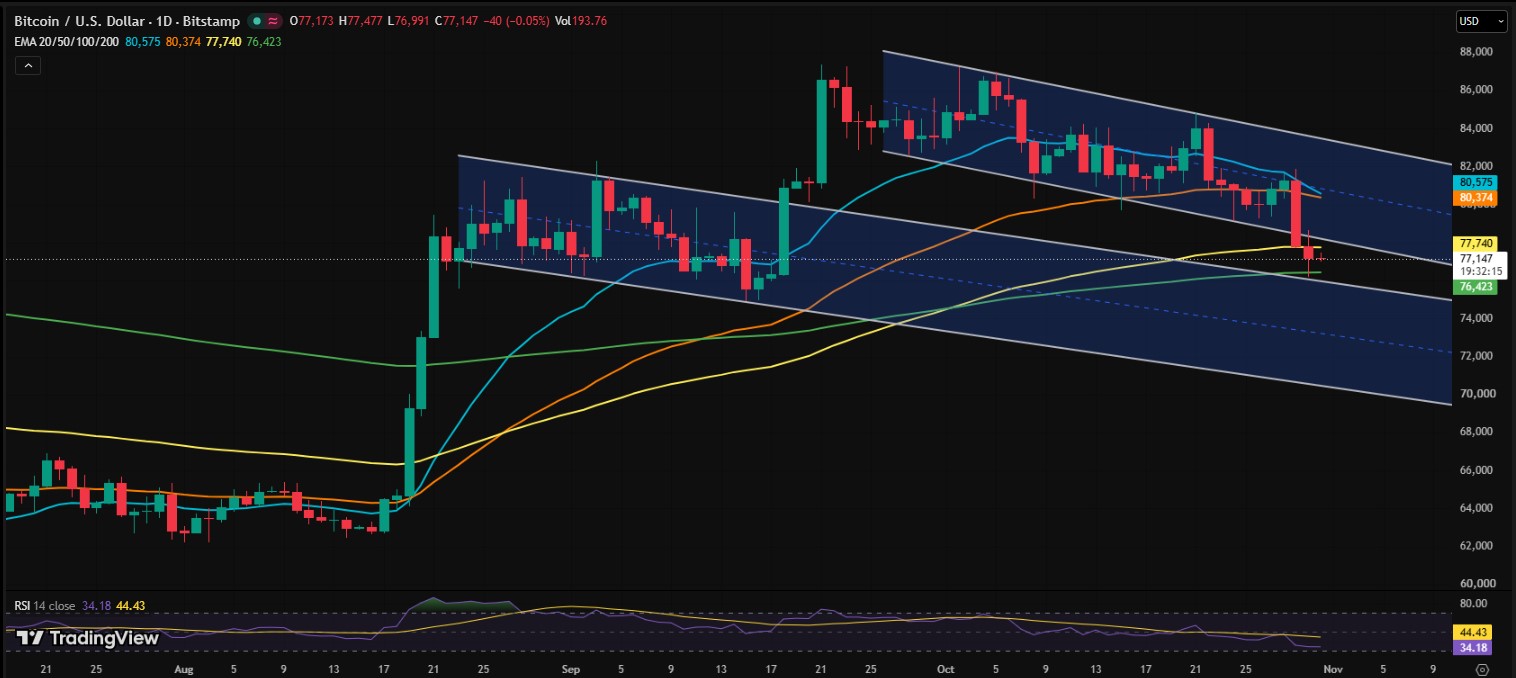
On the daily chart, BTC was rejected at the top of its descending channel. It then fell below the 20 EMA ($80,575) and the 50 EMA ($80,374).
Price now sits between the 100 EMA ($77,740) and the 200 EMA ($76,423). The RSI is 34.18, close to oversold. That can lead to a bounce, but it does not guarantee one.
Three Paths for BTC From Here
Scenario | What Needs to Happen | Levels to Watch |
Bullish | Holds above $76.4K and reclaims $77,700 to $78,000 | $80,000 to $80,500 |
Neutral | Trades between $76K and $78K | Sideways inside the channel |
Bearish | Daily close below $76,000 | $74,000, $73,000, then $72,000 to $70,000 |
Bulls Need $80K to Flip the Script
If buyers defend support and win back $77,700 to $78,000, a relief bounce toward $80,000 to $80,500 is possible. That zone holds the 20 and 50 EMAs.
A breakout above $80,500 would be the first meaningful sign of recovery. Until then, the channel points to a bearish-to-neutral outlook.
Bears Eye $74K, $73K and $70K if the Floor Cracks
A daily close below $76,000 would raise the odds of more losses. The first stop is $74,000.
Next comes $73,000. That is near the short-term holder cost basis, based on Glassnode data shared by Ali Charts. It is roughly where recent buyers break even.
Below that, the $72,000 to $70,000 zone comes into view. The upcoming US midterm elections add another layer of risk.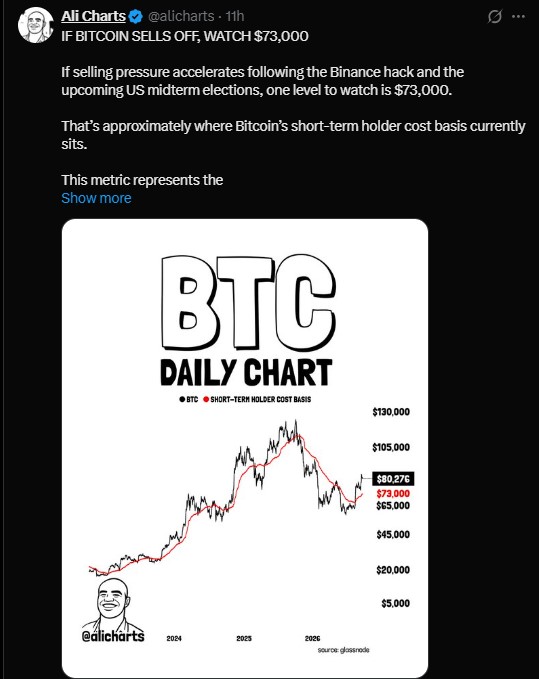
Derivatives Show Longs Exposed to More Pain
Metric | Reading |
Open interest | $53.33B (down 1.58%) |
Overall long/short ratio | 0.9467 |
Binance accounts long/short | 2.6724 |
Total liquidations (24h) | $161.89M |
Long liquidations | $100.73M |
Short liquidations | $61.15M |
Open interest is falling, so fewer traders are placing bets. Binance accounts lean heavily long. If the price keeps sliding, those longs may face another round of forced selling.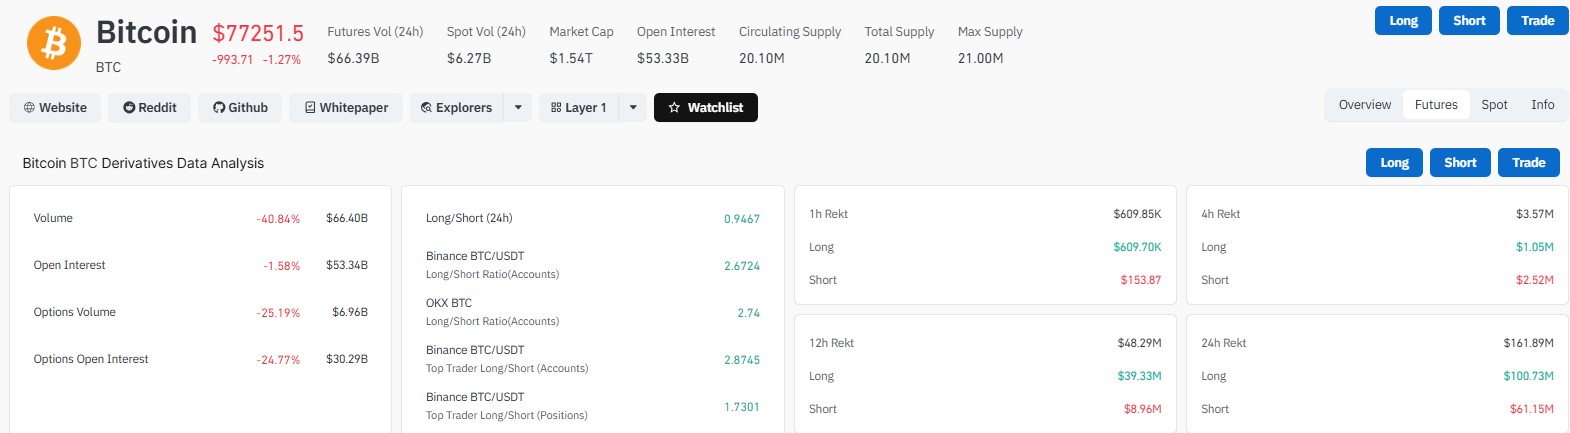
ETF Outflows Could Decide the Next Move
US spot Bitcoin ETFs saw $643.33 million in net outflows on October 30.
Fund | Daily Net Flow |
IBIT | -$233.70M |
FBTC | -$201.04M |
ARKB | -$129.55M |
GBTC | -$53.32M |
Total net assets are $98.14 billion, and cumulative inflows are still positive at $56.98 billion. If outflows continue, pressure on $76K could grow. If the flows turn green, a bounce gets easier.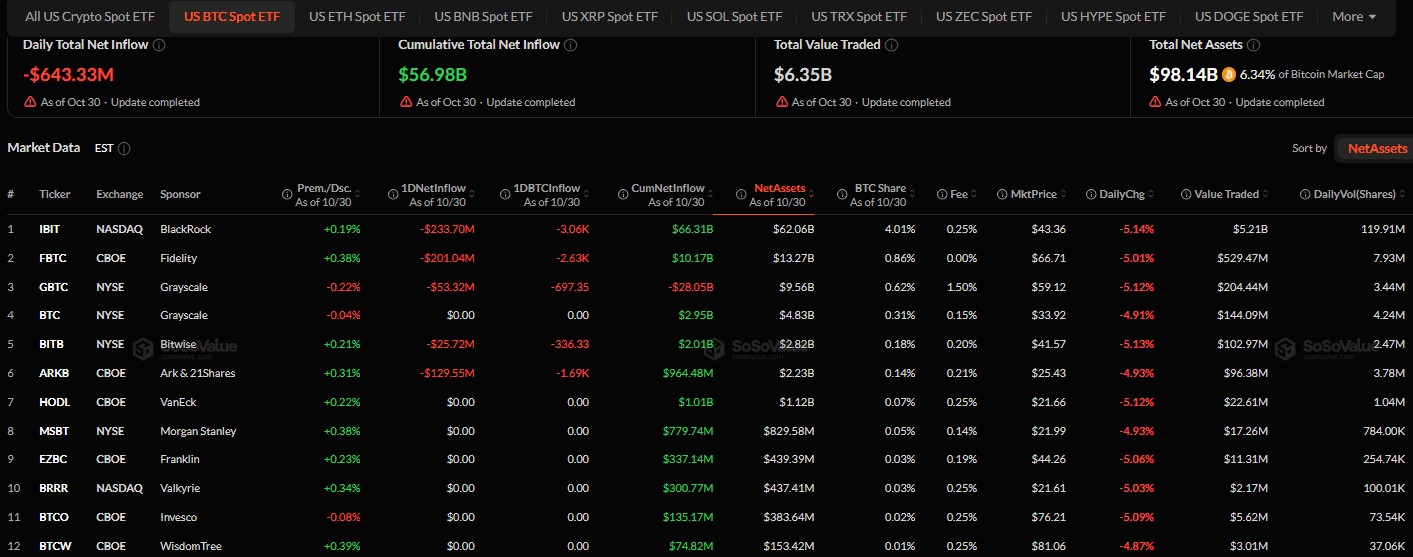
Rektober History and the Midterms Add Uncertainty
Bitcoin ended October higher in 10 of the 15 years from 2011 to 2025. Last year, October fell 3.95%, and November dropped 17.49%.
For 2026, BTC is down 11.68% so far. Past months do not decide future ones.
The Bottom Line
As per Santiment, Bitcoin sits at a crossroads.
Holding the $76.4K mark low and reclaiming $80K would suggest the panic is fading.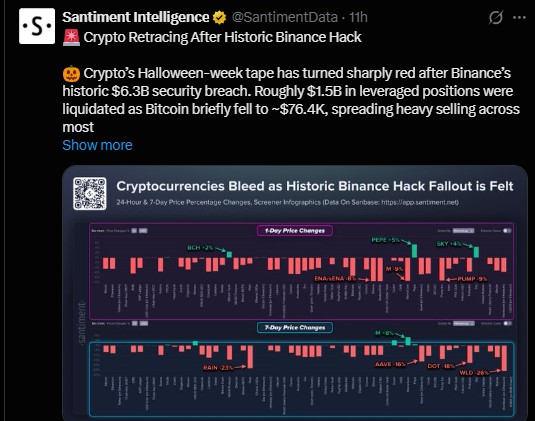
A clean break below $76K would keep markets in risk-off mode and make isolated green altcoins less convincing. Nobody can call the outcome with certainty. The next few daily closes should give better clues.
DISCLAIMER
This article is for information only and is not financial advice. Crypto assets are volatile and carry a high risk of loss. Do your own research and speak with a licensed financial advisor before making any investment decision.