Bitcoin Price Surge as Whales Hit a Record High, BTC Eyes $93,000


Bitcoin price today is $82,154.70, up 1.45% in 24 hours. That is a gain of $1,174.22. Still, BTC sits below a key resistance zone.
This BTC news today mixes a Fed speech, record whale wallets, and small ETF inflows. Here is what the data shows and where the price may go next.
Bitcoin News Today: Why Is BTC Price Up?
BTC bounced from the lower edge of its recent range. Its market cap is about $1.65 trillion. Spot volume is $5.46 billion.
Fed Chair Kevin Warsh spoke today. He said inflation is still a major challenge and the Fed wants to control it. He gave no hints about the next rate decision.
Warsh also sounded bullish on AI. He expects it to lift productivity and growth. He said its short-term effect on jobs is still unclear.
Arthur Hayes added to the news flow. On October 13, he told The Rollup that his fund trades other assets, like ETH, and uses the profits to buy more BTC.
He also said a token under $1 billion in market cap could beat BTC if AI agent demand lifts its value.
WuBlockchain notes that Hayes has a low forecast accuracy and often changes his views. Focus on his framework, not his price targets.
BTC Price Analysis: What Are the Key Support and Resistance Levels?
On the daily chart, BTC trades inside a descending channel. Price is near $82,100. That is below the 20-day EMA at $82,811 but above the 50-day EMA at $80,402.
The RSI reads 48.58, which is neutral.
The 100-day and 200-day EMAs sit at $76,784 and $75,757.
Level | Price Zone | Why It Matters |
Resistance | $82,800 to $84,000 | Near the 20-day EMA |
Breakout zone | $84,000 to $85,000 | Opens a move to $86,500 to $88,000 |
First support | $80,400 | 50-day EMA |
Second support | $78,000 to $76,800 | Near the 100-day EMA |
Risk level | Below $76,800 | Raises odds of a deeper dip |
Bitcoin Price Prediction: What Could Happen Next?
The short-term picture is mixed. The channel is bearish, but the wider trend still looks fairly strong after the big rally.
If BTC fails to reclaim $82,800 to $84,000, it could slide toward $80,400. After that, support sits near $78,000 to $76,800.
If buyers defend those levels and push above $84,000 to $85,000, a recovery toward $86,500 to $88,000 is possible. This BTC price prediction is not a promise. Price can move either way.
Is the BTC Market Bullish or Bearish Right Now?
Derivatives data looks balanced, with a slight bullish lean among traders.
Metric | Value |
Futures volume (24h) | $66.93 billion (down 13.64%) |
Open interest | $52.54 billion (up 0.53%) |
Overall long/short ratio | 1.0016 |
Binance BTC/USDT accounts | 1.5387 |
OKX BTC accounts | 1.59 |
Binance top traders (accounts) | 1.6462 |
Binance top traders (positions) | 1.4164 |
Options volume | $5.51 billion (down 2.72%) |
Options open interest | $40.84 billion (up 2.09%) |
24h liquidations | $92.78 million |
Longs lost $55.60 million. Shorts lost $37.19 million. Both sides got hurt, which points to choppy trading.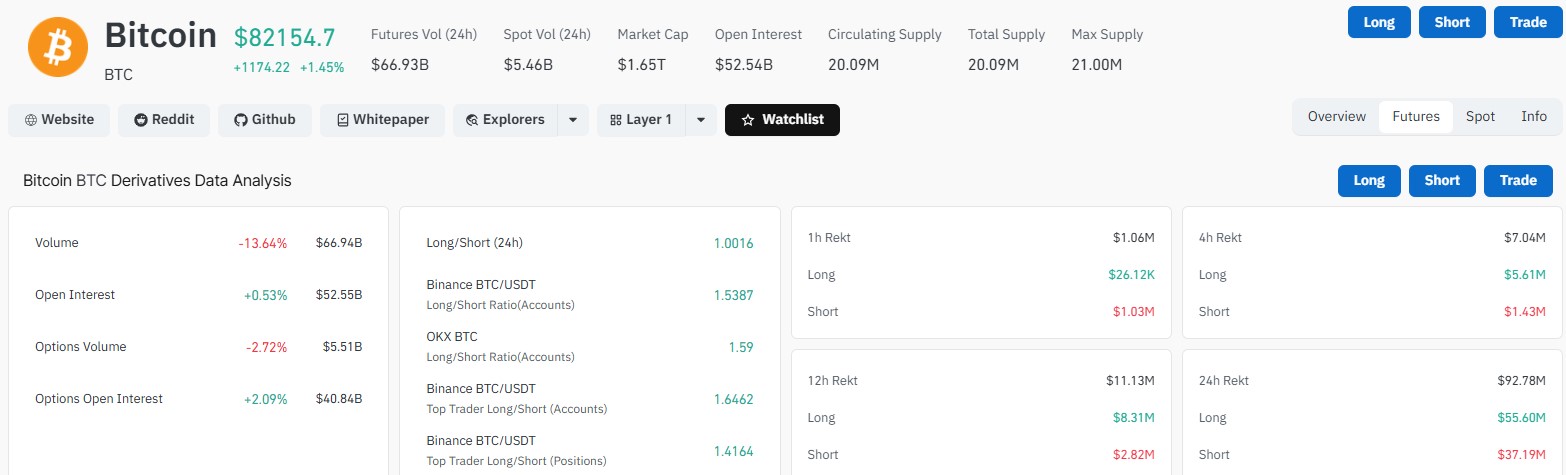
Are Bitcoin Whale Wallets Still Buying?
Yes, based on Santiment data. There are now 20,338 wallets holding 10 to 10K BTC. That is an all-time high.
The count has climbed sharply since mid-July, even with price swings. This group has often moved in step with BTC's longer direction.
More big holders joining while price chops can show steady confidence. Price may still fall short-term, though.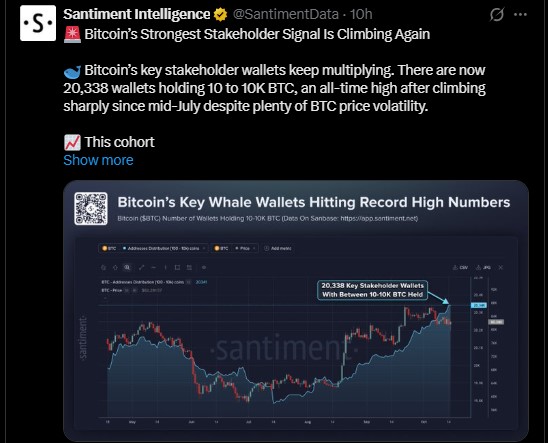
Are Spot BTC ETFs Seeing Inflows?
U.S. spot BTC ETFs recorded $5.06 million in net inflows on October 15, per SoSoValue.
ETF Metric | Value |
Daily net inflow | $5.06 million |
Cumulative net inflow | $56.96 billion |
Total value traded | $2.28 billion |
Total net assets | $105.71 billion |
Share of BTC market cap | 6.41% |

Bitcoin Price Forecast: Can BTC Hit $93,000?
A breakout above the channel's upper line could open the way to $93,000. The chart shows a possible move of 7,333 points, or 8.58%. The last similar move was 6,867 points, or 8.52%.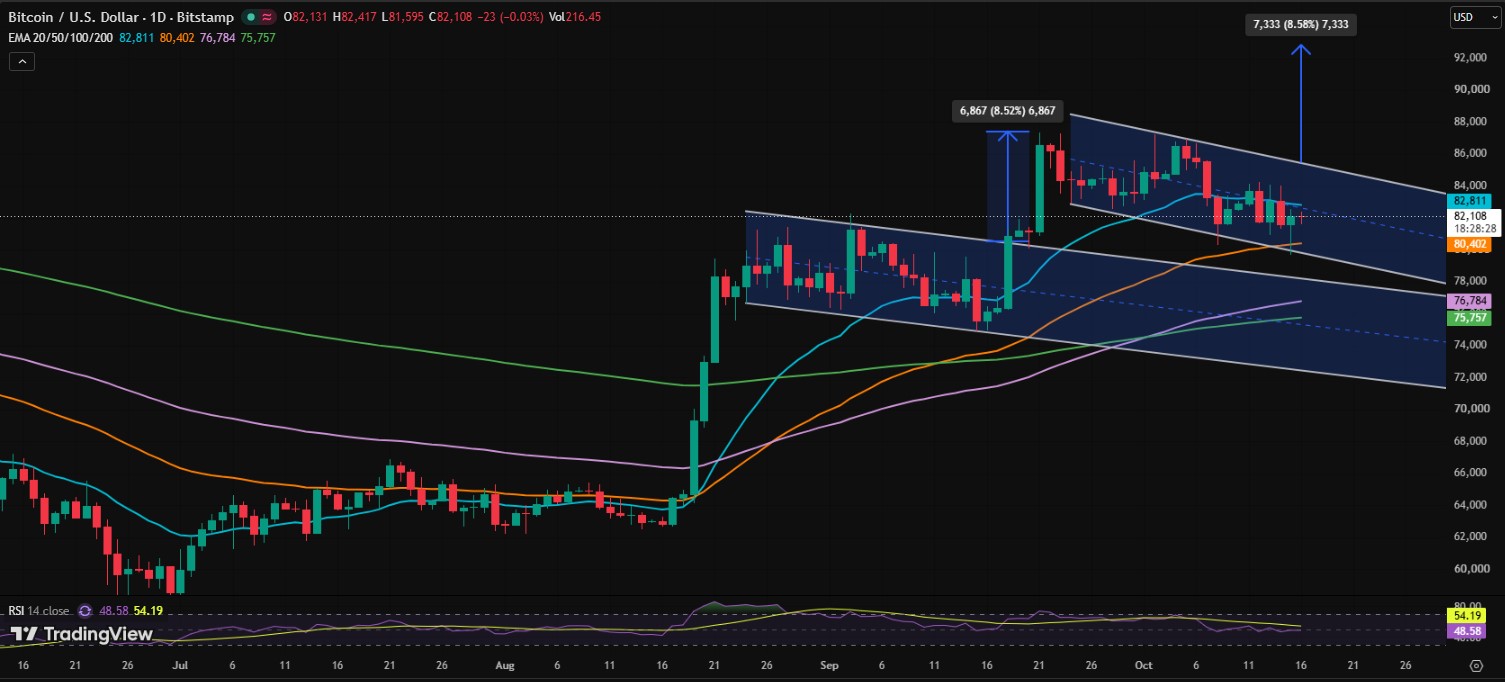
Analyst Ali sees it a bit differently. He believes BTC is in an ascending channel. After bouncing from the lower line, he sees $88,000 first, then $93,000.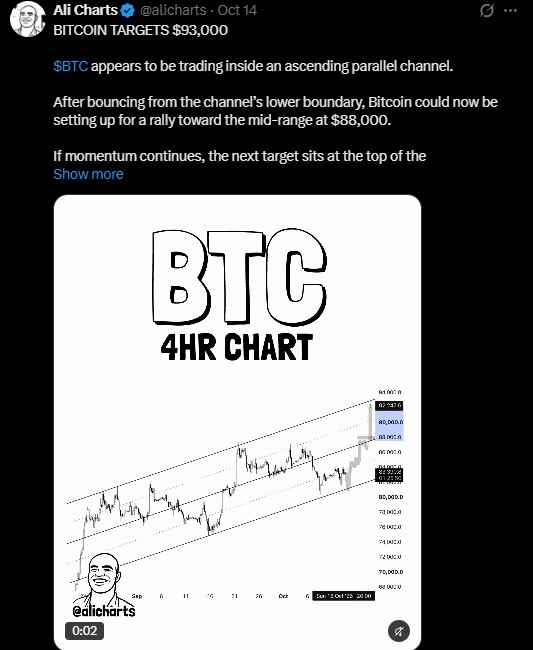
Two chart views, two shapes. A drop below $76,800 would weaken the bullish case.
Disclaimer: This article is for information only and is not financial advice. Cryptocurrency prices are highly volatile, and you can lose some or all of your money. Price targets are not guarantees. Do your own research and speak with a licensed financial advisor before you invest.
















