Pi Network Price Prediction: Could PI Be Crypto’s Next 100x Surprise?


Pi Network to hit $100, alongside a Bitcoin call of $1,000,000, in the same window as separate reports that the Pi Core Team is exploring stablecoin implementation on the network.
PI is trading at $0.08024, up a modest 3.5% today. Based on the chart alone, $100 is nowhere close to anything currently projected: the furthest level marked is $0.15000, roughly 87% below that claim.
This Pi Network Price Prediction looks at both pieces of news and what the chart's own measured-move levels actually show.
Pi Network News Today: Pi Core Team Exploring Stablecoin?
A post on X reports that the Pi Core Team has acknowledged it is openly exploring stablecoin implementation on the Pi Network, suggesting stablecoins could become a bigger focus for the project.
No specific product, timeline, or technical detail was included in what CoinGabbar reviewed.
Source: Data From X
This is an early-stage exploration rather than a confirmed launch, and CoinGabbar could not independently verify further details beyond the post.
Pi Network News: A Trader Calls for PI at $100
Separately, a post from Alpha Whale on X says PI is going to $100, in the same post predicting Bitcoin reaching $1,000,000.
At today's price of $0.08024, reaching $100 would require roughly a 1,246x move, a scale with no support from current chart levels or any catalyst CoinGabbar could identify.
This is one trader's speculative call, not a technical forecast.
Why is PI’s price up today?
Pi Network price today is up 3.5% to $0.08024 in 24 hours, outperforming a modestly higher market, primarily driven by anticipation of today's scheduled Protocol 28 mainnet upgrade.
Primary reason: Scheduled Protocol 28 mainnet upgrade, enhancing transaction-data handling and smart-contract management.
Secondary reasons: General market uplift (Bitcoin +1.39%) and an oversold bounce from recent declines.
PI Technical Analysis
PI is trading at $0.08024, up 3.5% on a candle that opened at $0.07998 and ranged between $0.07922 and $0.08024.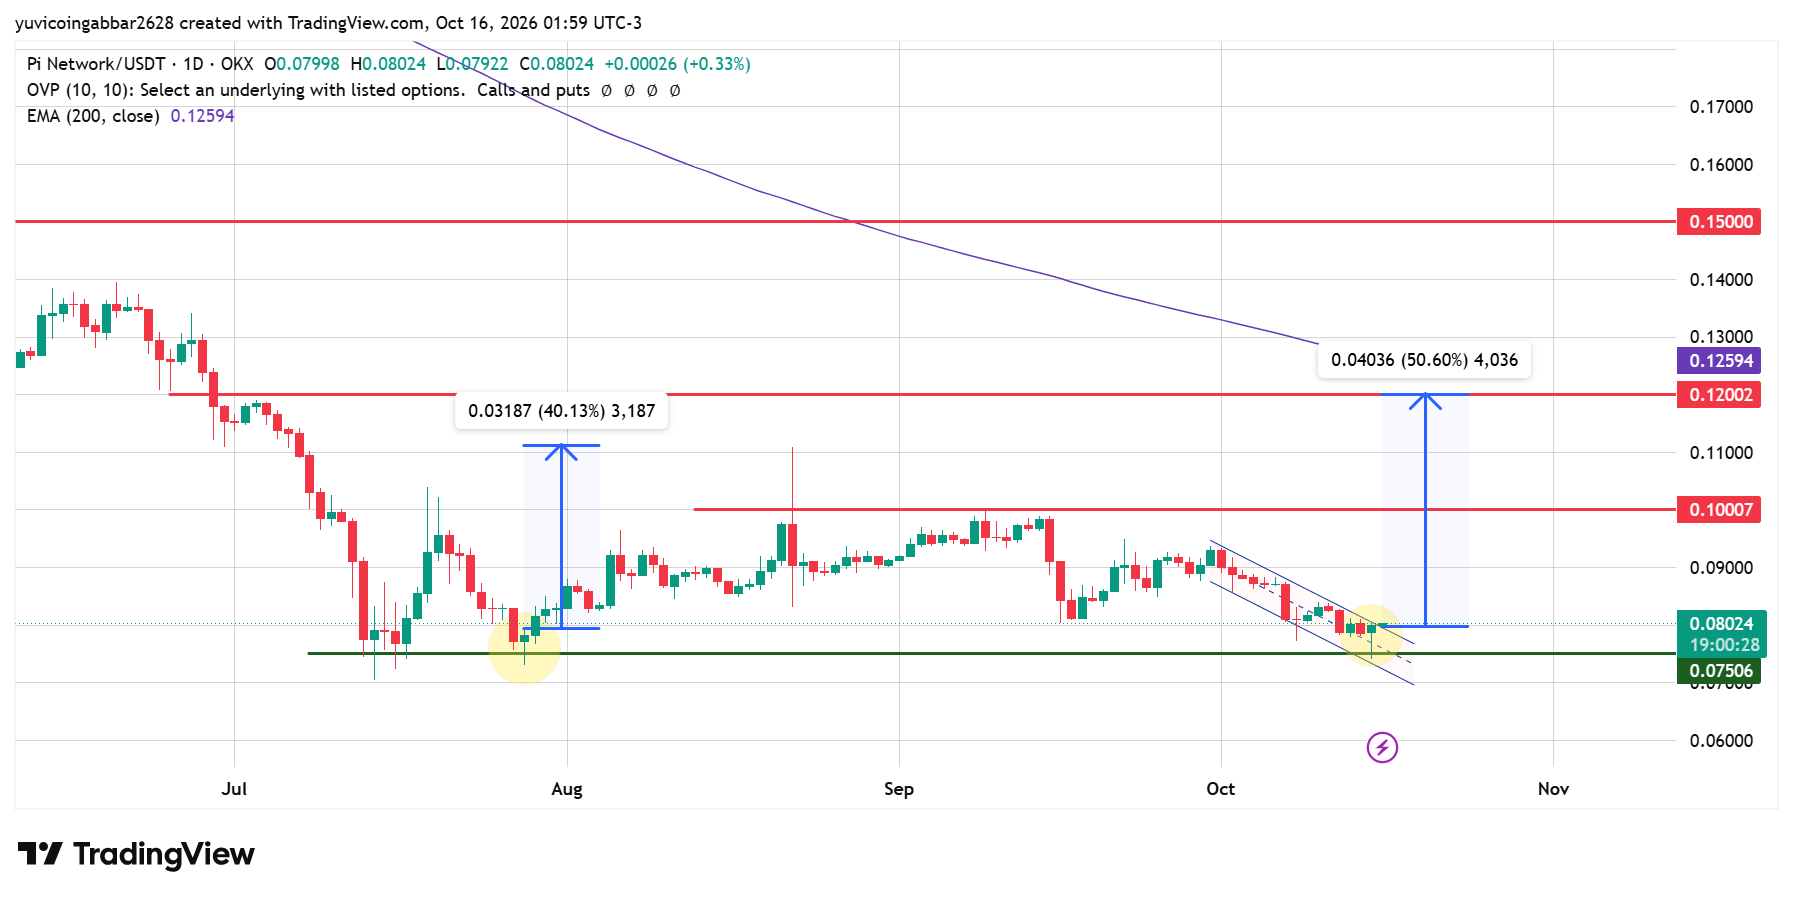
Price has been pressing against the lower boundary of a short-term descending channel, with $0.07506 marked as support just below.
Back in early August, the price printed a hammer, a candle with a small body near the top of its range and a long lower wick, which forms when sellers push the price down during the session but buyers step in hard enough to drag it back up by the close.
That August hammer formed right at the same support zone PI is testing now, and it was followed by the 40.13% move toward $0.10007.
A similar-looking candle has formed at the current support zone, which is why the chart marks a matching 50.60% projection toward $0.12002 from here.
This is a visual pattern repeat, not a guaranteed outcome, since a hammer only signals that buyers defended a level on that candle, not that the same size move will follow again.
Clearing $0.12002 would put $0.15000 into view further out. The 200-period EMA, currently at $0.12594, sits well above price and would need to be reclaimed for these higher targets to look realistic.
PI Price Scenarios: Bull, Base, and Bear Case
Bull case: A daily close above the channel's upper boundary would support the chart's measured-move projection toward $0.10007, then $0.12002.
Base case: PI continues consolidating near $0.08, testing the $0.07506 support without a decisive break either way.
Bear case: A daily close below $0.07506 would open a slide with no further chart level marked below it in this setup.
Support
$0.07506 is the key support directly beneath the current price.
Resistance
$0.10007 is the first resistance from the measured-move projection, followed by $0.12002 and $0.15000.
PI Forecast: Triggers and Invalidation
Scenario | Trigger | Likely Outcome | Invalidation |
Channel breaks up | Close above $0.08024 with follow-through | Push toward $0.10007 | Close below $0.07506 |
Range holds | Consolidate near 0.075–0.080 | Base forms | Break below $0.07506 |
Channel breaks down | Close below $0.07506 | Slide below marked support | Reclaim $0.07506 |
Pi Network Price Prediction: Could PI Really Hit $100?
Not based on anything visible on this chart. The furthest level currently marked is $0.15000, itself a multi-stage target requiring PI to clear $0.10007 and $0.12002 first.
Reaching $100 would need a move roughly 650 times larger than that already-ambitious target. The stablecoin exploration news is a genuine long-term development worth tracking, but it comes with no specifics that would support a move of this scale, and the $100 figure is best treated as speculation rather than a forecast.
Pi Network Price Prediction 2026: Expert Analysis
According to CoinGabbar analysts, PI is testing the lower edge of its recent channel, with $0.07506 the level that matters most right now.
The stablecoin news adds a fundamental storyline, but without a rollout timeline, it isn't something the chart already prices in.
The $100 call circulating alongside it sits entirely outside anything the chart's own levels project. This read is based on the daily chart levels above.
Disclaimer
This article is for informational purposes only and isn't financial advice. Crypto markets are volatile. Always do your own research before making any trading decisions involving PI.
















