BlockDAG Listing Delay: Why Did the Website Countdown Get Longer?

BDAG Gives Back a 5.38% Spike as the Website Countdown Grows
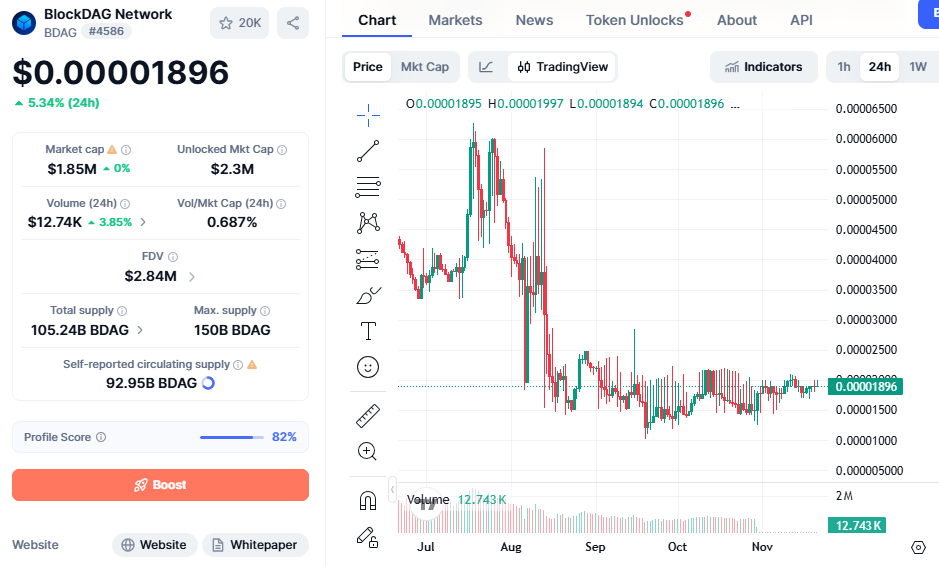
BDAG traded near $0.00001896 on Nov 21, 2026, up 5.34% in 24 hours, according to CoinMarketCap.
The project's website countdown is now longer than it was a day earlier. This report asks whether a BlockDAG listing delay explains that change and maps the chart around it.
What Changed on the Website Panel Between Nov 20 and Nov 21
The website banner still says the presale is complete and all sales are closed. The same panel still shows the labels "CEO & Team Reveal" and "Trading Starts". Only the countdown under them has changed.
Reading date | Countdown shown |
Nov 20, 2026 | |
Nov 21, 2026 | 3 days, 13 hours, 52 minutes, 3 seconds |
A countdown that was nearly finished now shows more than three days. The project has not announced a BlockDAG listing delay or explained the change. The panel gives no exchange, trading pair or date.
The tracker lists BDAG, which already trades. It shows no market data for NEW BDAG.

Source: Official Website
Could a BlockDAG Listing Delay Explain the New Timer?
A longer countdown does not prove a delay. It proves only that the displayed target moved. Three explanations fit what the panel shows, and the project has confirmed none of them.
Readers should keep the labels in view. "CEO & Team Reveal" and "Trading Starts" sit above one clock. If the clock counts toward the reveal, a later target says little about trading.
If it counts toward trading, a BlockDAG listing delay becomes the natural reading. Only an official post can settle that.
Candle Read: A Spike to 0.00001997 and a Full Round Trip
The latest daily candle opened at 0.00001895 and touched a low of 0.00001894. It spiked to 0.00001997, which is 5.38% above the open. It then closed at 0.00001896, almost exactly where it began.
The spike stopped 0.15% short of 0.00002000, and the quote gave back all of it. The tracker shows +5.34% over 24 hours, while the candle shows about 0%. The two cover different time windows.
Quote: $0.00001896, up 5.34% in 24 hours.
Market cap: $1.85M, against an FDV of $2.84M. FDV means fully diluted valuation.
Unlocked market cap: $2.3M.
24h volume: $12.74K, up 3.85%, equal to 0.687% of market cap.
Volume rose while the quote went nowhere. A round trip on higher activity shows that buyers and sellers both met the spike.
Source: CoinMarketCap Chart
Note: Prices can change quickly, so figures may not reflect the latest value. Readers should check a live price tracker for current data.
Hypothesis Matrix: What Each Explanation Means for the Chart
Each row pairs one explanation with a chart reading. Levels come from the chart axis and are approximate.
Explanation | Evidence for | Evidence against | Chart reading |
Target moved later | The countdown is longer | No official post says so | Weaker catalyst, lean bearish |
Clock counts to a different event | Two labels share one clock | The project has not said | Neutral, range holds |
Display reset or glitch | The jump is abrupt | No source confirms it | Neutral, no signal |
The chart splits the same way. The base case keeps candles between 0.00001800 and 0.00002000, which sit 5.06% below and 5.49% above the close.
A close above 0.00002000 on rising volume would point to 0.00002200, which is 16.03% higher. A close below 0.00001800 would point to 0.00001500, which is 20.89% lower.
A confirmed BlockDAG listing delay would push the bear case forward. A named exchange and date would push the bull case forward.
Expert Opinion: Why a Timer Change Is Not a Confirmed Delay
Chart readers usually separate a project signal from a market signal. A moved timer is a project signal, and it needs an official post to count. The spike and round trip are market signal, and it says buyers could not hold 0.00002000.
A BlockDAG listing delay, if confirmed, would lengthen the wait for new liquidity. Until the project explains the change, readers can only compare readings and watch the chart. Both a hold near 0.00001896 and a slide to lower levels remain possible.
Conclusion: The Next Timer Reading and the Next Close Matter
BDAG returned to its open after a 5.38% spike, and the countdown now runs longer.
A clear post from the project would settle any BlockDAG listing delay. Until then, closes above 0.00002000 or below 0.00001800 carry the most weight.
Disclaimer: This article is for educational and informational purposes only. It is not financial advice and does not guarantee returns. Price scenarios are chart-based estimates, and crypto markets carry high risk. Readers should research independently before making any decision.