BLORB Price Prediction: Can This Meme Token Hold Its Breakout?

A tiny meme token on a brand-new chain just posted a four-digit percentage move in under a day, and almost nobody outside a small circle of traders noticed until the chart broke.
BLORB Wakes Up: What's Driving The Sudden Spike
BLORB price action turned heads early on September 14, 2026, when the token jumped hard inside a single trading session, and it's already got traders searching for a BLORB price prediction. It's not a coin with years of history behind it. Recent meme coin news coverage has flagged similar setups before, and this one carries the same mix of thin liquidity and outsized moves. Volume spiked. Price followed. But does a move this fast, this early, actually mean anything for where BLORB goes next?
BLORB Snapshot: The Facts Before The Hype
BLORB is a meme token running on Robinhood Chain, an ERC-20 style network tied to the Robinhood ecosystem. Its contract address is 0x4d14284aFe559B7c6B9e6FAd6ebAeaA0F6051818.
As of 03:50 UTC on September 14, 2026, BLORB traded at $0.04254, with a circulating market cap near $42.4 million on a fully diluted valuation of roughly the same figure, since all one billion tokens are already in circulation.
Momentum has been extreme. The token's all-time high, $0.04258, was set just 33 minutes before this snapshot. Its all-time low, $0.003932, came only about 14 hours earlier. Part of that early attention tracks with broader interest in active crypto airdrops on newer chains, though nothing here confirms a direct link.
That's a token barely a day old, showing a near-eleven-times range. Important: multiple tokens using the "BLORB" name circulate across different chains and exchanges. Traders should verify the contract address above before buying anything labeled BLORB.
BLORB Price Prediction: Quick Overview
Metric | Current Reading |
BLORB Price | $0.04254 |
24H Change | +955.2% |
Market Cap | ~$42.4M |
24H Volume | ~$29.37M |
Network | Robinhood Chain |
Trend | Bullish, short-term overheated |
Next Resistance | $0.04258 (ATH zone) |
Key Support | $0.01768 (EMA 50) |
RSI | 97.06 |
Near-Term Read | Overbought, pullback risk |
BLORB Technical Analysis
Current Trend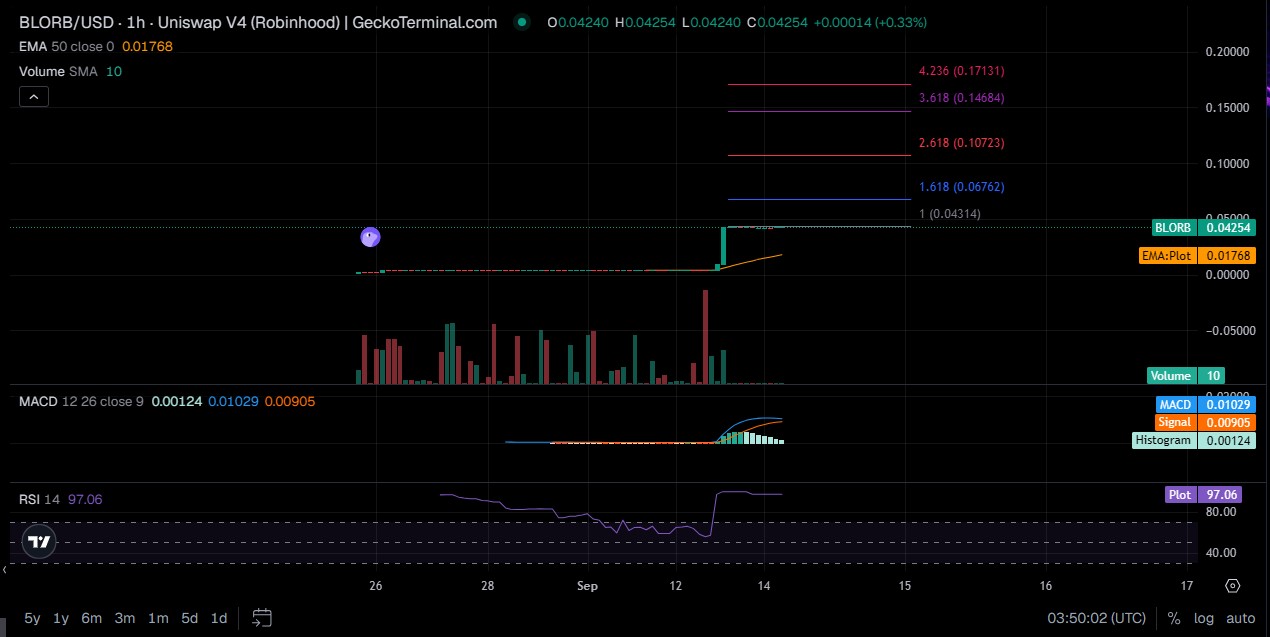
Short-term, the trend is sharply bullish. Medium-term is harder to call, since medium-term barely exists yet for a token this young. On the higher timeframe, there's simply not enough trading history to draw a reliable line. One clean vertical move doesn't make a trend; it makes a spike.
RSI Analysis
The 14-period RSI sits at 97.06 on the hourly chart. Anything above 70 usually flags overbought conditions. A reading near 97 is extreme by any standard.
There's no divergence visible yet, because there isn't enough price history to form one. Turns out, that's normal for a token this fresh. And it's also a warning sign on its own.
MACD Analysis
The MACD line reads 0.01029 against a signal line of 0.00905, with the MACD sitting above the signal. The histogram shows 0.00124, small but positive.
Momentum favors buyers right now. But momentum indicators built on a few hours of trades carry less weight than the same indicators on a mature chart. Context matters here.
Volume Analysis
Volume is the loudest part of this story. According to CoinGecko, trading volume has surged dramatically alongside the price move, with 24-hour volume running close to the token's entire market cap.
That ratio is unusual. High volume relative to market cap can mean genuine new interest. It can also mean a small number of wallets trading back and forth. Worth watching either way.
BLORB Support and Resistance Levels
Key Support
The 50-period EMA on the hourly chart sits near $0.01768, well below current trading levels. That gap is wide, and it leaves room for a sharp pullback without technically breaking trend structure.
Key Resistance
Immediate resistance sits at the all-time high, $0.04258, set at 03:17 UTC on September 14, 2026. Fibonacci extension levels above that cluster near $0.06762, $0.10723, and $0.14684.
Breakout Level
A confirmed close above $0.04258 on rising volume would open a path toward the next Fibonacci extension near $0.06762. Confirmation needs to come from sustained trading activity, not a single wick.
Breakdown / Invalidation Level
A drop back under $0.01768, the EMA line, would undercut the short-term uptrend structure entirely. That level is the one to watch. Below it, the bullish read loses most of its support.
Can BLORB Reach $0.05 or $0.10?
This question comes down to market-cap math, not hope. With a fixed supply of one billion tokens:
$0.05 per token equals a $50 million market cap
$0.10 per token equals a $100 million market cap
$0.50 per token equals a $500 million market cap
$1.00 per token equals a $1 billion market cap
BLORB's current market cap near $42.4 million sits just under the $50 million mark tied to $0.05. Reaching $0.10 would roughly double the current market cap. Neither is mathematically far-fetched for a token this size. But size alone doesn't guarantee demand shows up to fill that market cap. That part isn't a math problem; it's a liquidity and adoption problem.
The same math applies across the board. Checking other coin price forecasts shows why market-cap arithmetic, not headline targets, is the more reliable way to size up any token's odds.
BLORB Market Cap and Supply Analysis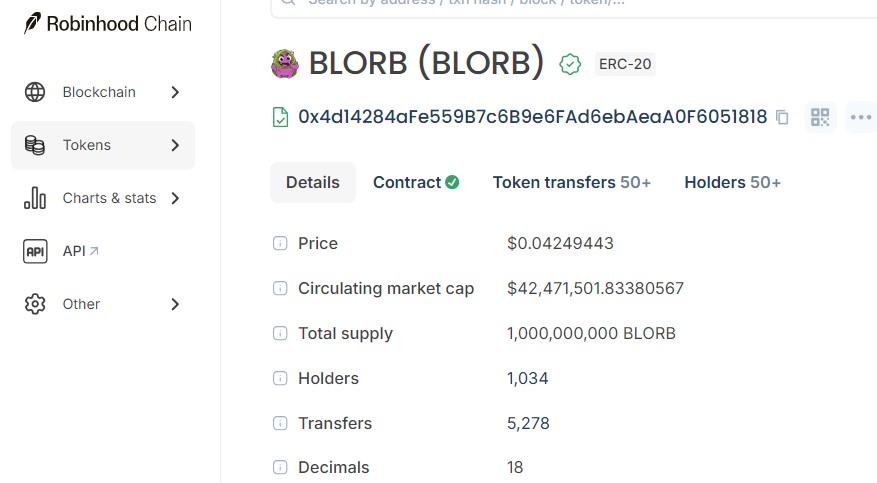
Circulating supply, total supply, and max supply all sit at one billion tokens, per Robinhood Chain's own block explorer data. Since the full supply is already circulating, there's no future unlock schedule to price in.
The project's official site lists a 0% buy tax and 0% sell tax. Holder count stood at 1,034 wallets at the time of this snapshot, a small base for a token trading tens of millions in daily volume.
BLORB On-Chain and Whale Analysis
Holder Distribution
Just over one thousand holders currently hold BLORB. For context, that's a small, early-stage distribution. Concentration risk tends to run high at this stage.
Whale Concentration
Detailed wallet-by-wallet concentration data wasn't verifiable at the time of writing. Given the low holder count, it's reasonable to assume a handful of wallets control a meaningful share of supply. That's typical, not necessarily alarming, but it's a factor.
Liquidity
Liquidity sits on Uniswap V4, tracked through the token's live GeckoTerminal chart. Thin liquidity pools can amplify both upside and downside moves.
Large Transactions
No verified whale-transaction data was available in this snapshot. Traders who want that detail should check the block explorer directly before trading size.
BLORB Price Data Discrepancy: Why Prices May Differ
Different sites can show different BLORB prices at the same moment, and that's not automatically a bug.
Aggregator prices, like the ones shown on CoinGecko, often average or weight multiple sources. DEX pool prices, pulled directly from a single Uniswap pair, reflect the exact trade happening on that pool at that second.
Liquidity depth changes how much a trade moves the price. Different trading pairs, timing lags between data refreshes, and slippage on larger orders all add small gaps between sources.
And then there's the same-name issue. Multiple tokens sharing the "BLORB" ticker exist across different networks. Checking the exact contract address before comparing prices, especially after new exchange listings, avoids that confusion entirely.
BLORB Catalysts
A few developments could shape where attention goes next. New exchange or DEX liquidity would deepen the trading pool and reduce slippage. Community growth and meme-driven social momentum tend to move fast for tokens like this.
New ecosystem integrations tied to Robinhood Chain activity could add utility beyond speculation. Broader exchange listings across the sector sometimes pull attention toward smaller chains too.
The project's own account has referenced a CoinMarketCap listing request, which, if approved, would raise visibility. Nothing here is confirmed yet. Checking an events calendar for confirmed listing dates is a more reliable approach than assuming timelines.
BLORB Risks
Meme-coin volatility tops the list. A token that moved 955% in a day can move just as hard in reverse.
Liquidity risk sits close behind. Thin pools mean large orders can swing the price sharply in either direction.
Whale concentration, tied to the low holder count, adds another layer. Contract risk always applies to new deployments, even audited ones. Same-name token confusion remains a real, documented problem across exchanges.
Rapid price expansion this early often invites slippage on entries and exits. Narrative dependency matters too, since meme tokens live and die on attention. And a broader Bitcoin correction could drag smaller tokens down regardless of their own fundamentals.
Attention rotates fast across crypto. If focus shifts toward AI-linked crypto news or another trending narrative, a meme token's momentum can cool just as quickly as it built.
BLORB Trader Takeaway
Bullish above: $0.04258, the current all-time high.
Confirmation: sustained volume holding above that level across multiple hourly trades.
Target: $0.06762, the next Fibonacci extension.
Bearish below: $0.01768, the 50-period EMA.
Invalidation: a confirmed trade sequence under that EMA line.
That's the framework. Nothing about it guarantees an outcome.
Disclaimer
This article is for informational purposes only and does not constitute financial, investment, or trading advice. Cryptocurrency markets, particularly meme tokens with limited trading history, carry substantial volatility and risk, including the possible loss of the entire investment. Data referenced here reflects a snapshot. taken around 03:50 UTC on September 14, 2026, and prices, market cap, and holder figures can change rapidly.









.jpg)








