BNB Price Prediction: Can BNB Hold $675.71 Support This Week?


Is BNB about to lose the $675.71 support level, or is a bounce slowly building inside the wedge?
This BNB price prediction starts with a coin that trades at $680.39, below its main moving average. The earlier Binance restart coverage asked if BNB could reclaim $730, but sellers have since taken over the chart. Buyers still defend the support level near $675.71, and the next few candles will show if it holds.
BNB Outlook Starts With the Market Snapshot
BNB ranks 4th by market cap, and the CoinGecko market data captured Nov 11, 2026, 04:40 UTC, puts that cap at $89.404B. Market cap is the total value of all coins in circulation.
Metric | Value |
Price | $680.39 |
24-hour change | -1.4% |
24-hour range | $669.76 to $691.63 |
Market cap | $89.404B |
FDV | $89.404B |
24-hour trading volume | $686.667M |
Source: CoinGecko, BNB market snapshot, Nov 11, 2026, 04:40 UTC
FDV matches market cap because total supply equals circulating supply at 131.511M BNB. Data comes from CoinGecko as of Nov 11, 2026, 04:40 UTC.
BNB Price Forecast Against the 24-Hour Range
BNB is down 1.4% over 24 hours at $680.39, per CoinGecko data from 04:40 UTC. The 24H range runs from $669.76 to $691.63. Price sits $9.64 above the low and $12.23 below the high, so buyers lifted BNB off the 24-hour low but haven't reclaimed the high.
BNB Liquidation Data: Longs Took the Hit
Longs lost $1.59M in 24 hours. Total BNB liquidations reached $1.66M, per the CoinGlass liquidation data captured Nov 11, 2026, 04:40 UTC. A liquidation is a forced exit from a trade made with borrowed money, triggered when the trader's margin runs out.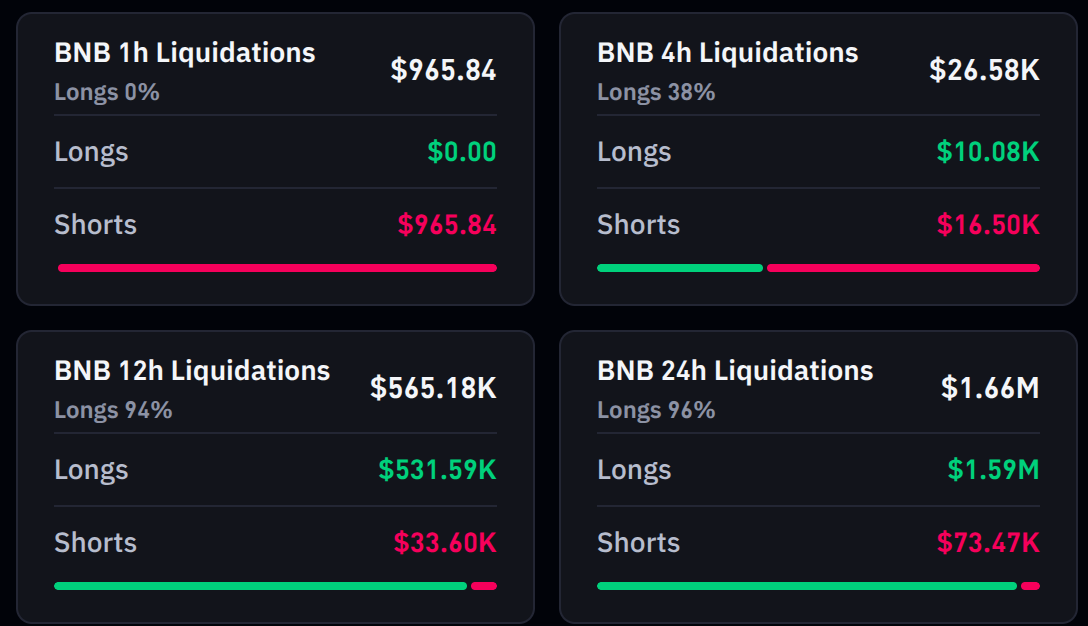
Source: CoinGlass, BNB liquidations, Nov 11, 2026, 04:40 UTC
At first, the $965.84 of short liquidations in the last hour reads like a squeeze. But the longer windows say otherwise. Over the last 12 hours, longs took $531.59K of losses against $33.60K for shorts. Longs made up 94% of 12-hour liquidations and 96% of the 24-hour total. Longs took most of the losses.
BNB Open Interest Data
Open Interest is the total value of futures contracts that traders still hold open. The CoinGlass open interest data shows BNB futures at $1.08B across exchanges, captured Nov 11, 2026, 04:40 UTC. Binance has $520.99M OI, about 48.2% of the total, and Gate follows at $153.31M.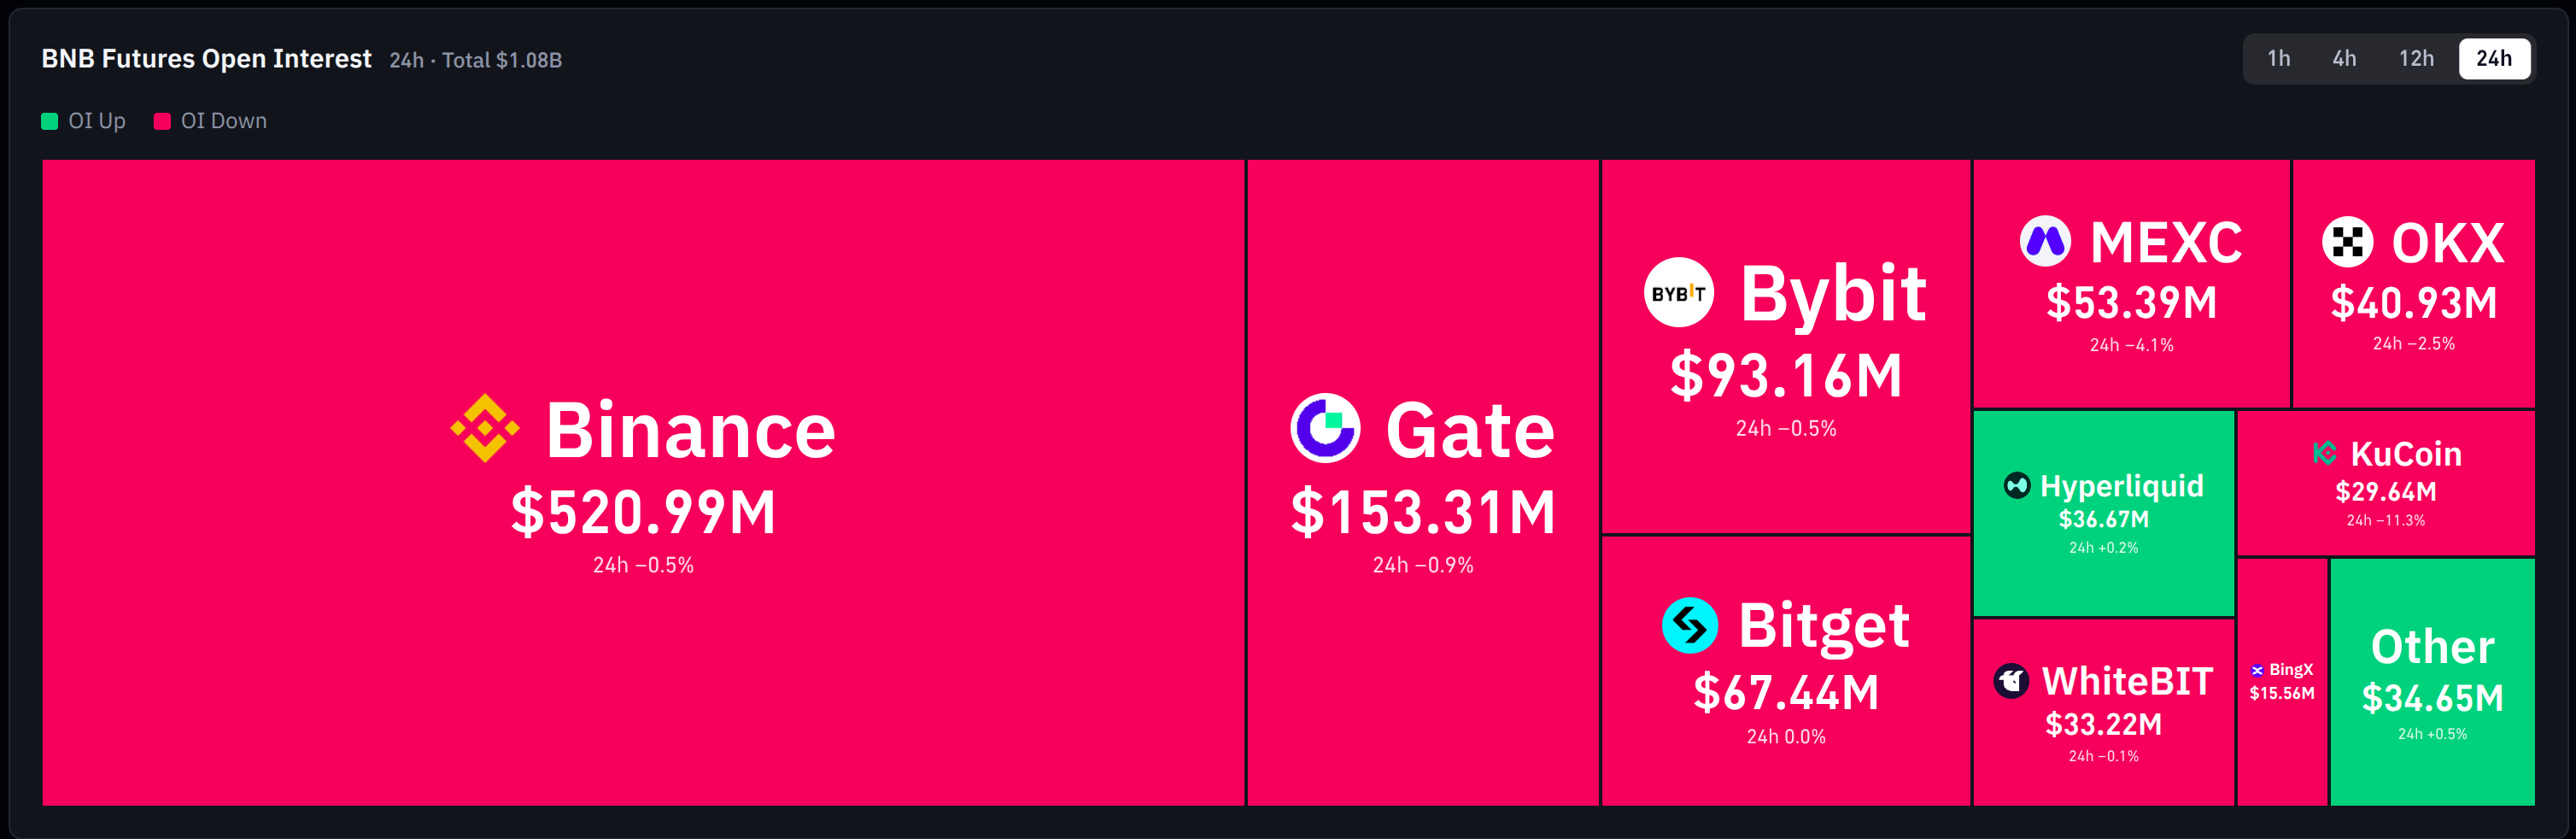
Source: CoinGlass Data, BNB futures open interest, 24 hours, Nov 11, 2026, 04:40 UTC
Open interest fell on most listed exchanges over 24 hours. Binance slipped 0.5%, and KuCoin dropped 11.3%, while Hyperliquid added 0.2%.
BNB Technical Analysis: Falling Wedge, 50 EMA, and RSI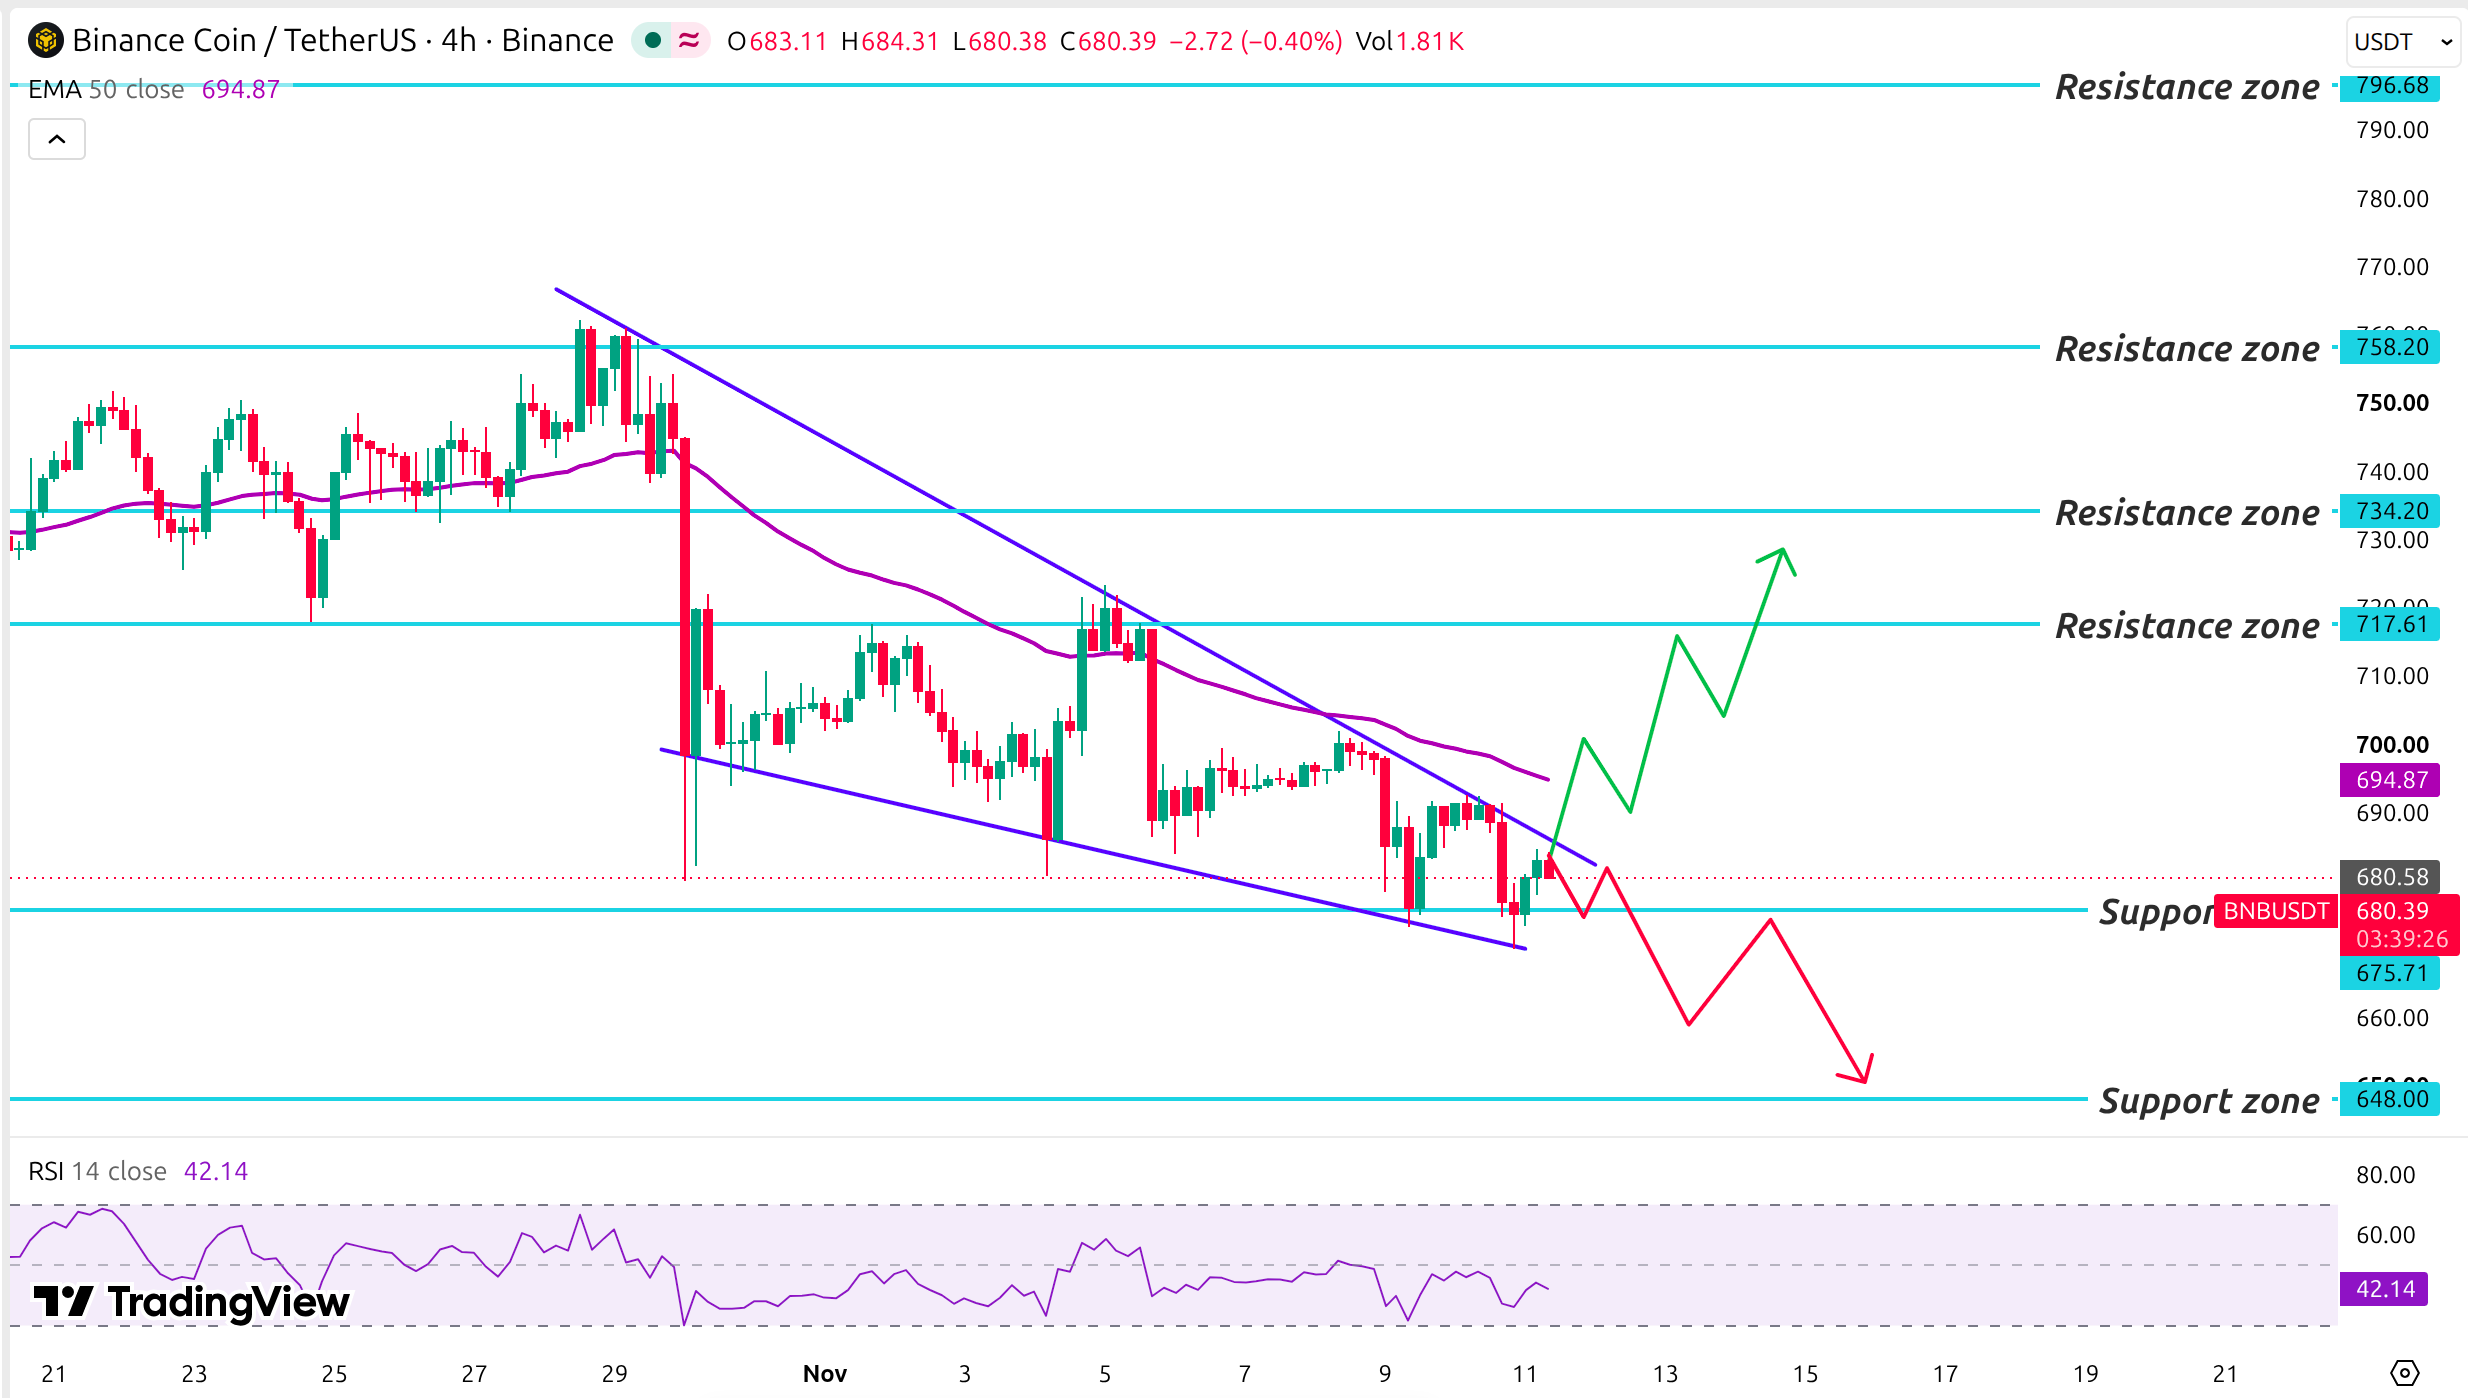
Source: TradingView, BNBUSDT , EMA 50, and RSI 14, Nov 11, 2026, 04:40 UTC
The Binance 4-H chart for BNB/USDT on TradingView, captured Nov 11, 2026, 04:40 UTC, frames this BNB price prediction. A sharp October rally spiked to the $758.20 resistance level before sellers took control.
On Oct 30, a long red candle dropped the price far below the $717.61 resistance zone, where sellers have rejected the price. Since then, BNB trades inside a falling wedge, two falling lines that squeeze price together. A falling trendline, a line joining those lower highs, now caps BNB price action.
The market tried many times to break it, including a Nov 5 push into the 50 EMA, but sellers defended the trendline. The $675.71 support zone, where buyers have stepped in, sits near the base of the wedge. The lower highs echo the selling pressure in the earlier BNB outflow analysis. Right now, BNB trades above that support and under both the trendline and the EMA.
The BNB 50 EMA sits at $694.87. That's 2.28% above the $680.39 price, and the latest 4-H candle trades below it, and the falling trendline sits nearby, so a real recovery needs both levels to break.
The BNB RSI reads 42.14 on the 14-period setting. It touched about 70 around Oct 22. A reading under 50 means sellers hold the momentum edge. And a reading above 30 means oversold conditions haven't formed, so the price has room to fall."
BNB Support Levels and Resistance Levels
Level | Role |
$796.68 | Resistance zone |
$758.20 | Resistance zone |
$734.20 | Resistance zone |
$717.61 | Resistance zone |
$694.87 | 50 EMA |
$675.71 | Support zone |
$648.00 | Support zone |
The nearest support levels and resistance levels are $675.71 below and $694.87 above.
Bull, Base and Bear Scenarios for BNB
Scenario | Trigger | Target | Invalidation |
Bull | 4-hour candle above the $694.87 level | $717.61, then $734.20 | 4-hour candle below the $675.71 level |
Base | Price holds at $675.71, staying under $694.87. | Range between both levels | 4-hour candle outside either level |
Bear | 4H candle below $675.71 | $648.00 | 4-hour candle above $694.87 |
The base case holds until a 4-H candle trades outside the $675.71 to $694.87 band. Key risks are technical invalidation and sharp swings in leveraged positions.
BNB price prediction: Expert Outlook
As per CoinGabbar analysis, this BNB price prediction stays cautious. Sellers hold the edge, since RSI sits at 42.14 and BNB trades under its 50 EMA. But liquidations of $1.66M and falling open interest show no panic, so a break below $675.71 points to $648.00 as the first stop.
The level to watch is $694.87. A 4-H candle trading above it with RSI back above 50 hands buyers the near-term edge.
Disclaimer: This article is for information only and isn't financial advice. Traders should do their own research and risk only what they can afford to lose.