BlockchainFX Price Slides 61.75%: Will Thin Trading Still Hold Floor?


Nov 11 Chart Check: A 61.75% Daily Slide on Thin Liquidity
A token chart reading on Nov 11, 2026, shows BFX at $0.0000825, down 61.75% over 24 hours, and the tracker again marks the figure as low confidence.
The line moved lower in steps, held a flat shelf near $0.000105 into the morning, then dropped to a wick bottom near $0.000047 before bouncing. The BlockchainFX price now sits far below the levels it held a day earlier.
Metric | Reading |
Latest quote | $0.0000825 |
24-hour change | -61.75% |
TVL | $3.7K |
FDV | $262.7K |
1-day volume | $9.7K |
52-week range | $0.0000381 to $6.40 |
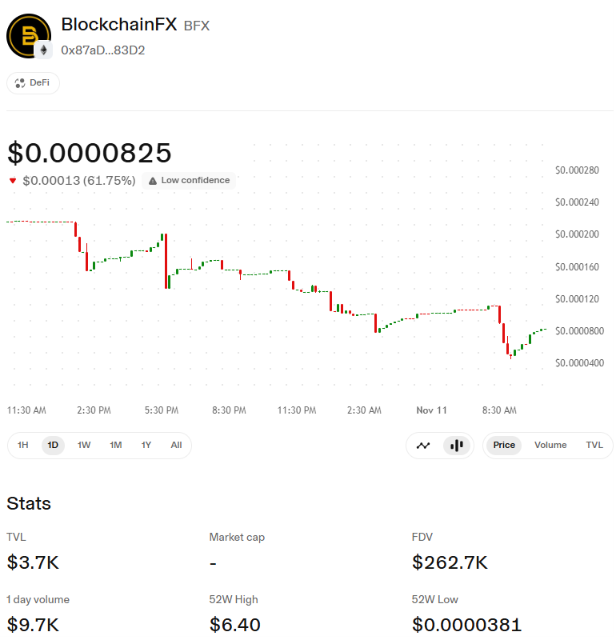
Source: Uniswap Chart
Note: Prices can change quickly, so figures may not reflect the latest value. Readers should check a live price tracker for current data.
BlockchainFX Price Ladder: FDV Implied at Each Level
A quote and a valuation move together, so every level on the chart carries an FDV tag. The BlockchainFX price needs a long climb to restore the valuation it had a day ago, since a 61.75% loss takes a gain of roughly 161.4% to undo.
The table scales FDV in line with the quote and assumes the tracker’s supply count stays unchanged.
Level | Move vs latest | Implied FDV |
$0.0000381 (52-week low) | -53.8% | around $121.3K |
$0.000060 | -27.3% | around $191.1K |
$0.0000825 (latest) | 0% | $262.7K |
$0.000125 | +51.5% | around $398.0K |
$0.000165 | +100.0% | around $525.4K |
$0.000250 | +203.0% | around $796.1K |
Volume at 262% of TVL: What Heavy Turnover Can Mean
Trading activity shapes the BlockchainFX price more than usual when a pool is this small. Four readings stand out:
Turnover: daily volume of $9.7K is roughly 2.6 times the $3.7K TVL.
Depth: TVL equals about 1.4% of FDV, so very little capital backs each level.
Direction: turnover this high on a falling line points to sellers, though a single wallet could account for much of it.
Reliability: the tracker’s confidence label means the figure can shift quickly between readings.
Rebounds on this depth need follow-through before they count as a change of trend.
Forecast Table: Seven-Day and 30-Day Ranges From $0.0000825
This BlockchainFX price prediction starts from the latest quote and treats the 61.75% slide as a starting condition, not a trend that must continue. The price ranges below are estimates, not guaranteed outcomes.
Scenario | Next 7 days | Move vs latest | Next 30 days | Move vs latest |
Bear | $0.000035 to $0.000065 | -57.6% to -21.2% | $0.000025 to $0.000050 | -69.7% to -39.4% |
Base | $0.000060 to $0.000110 | -27.3% to +33.3% | $0.000050 to $0.000125 | -39.4% to +51.5% |
Bull | $0.000120 to $0.000170 | +45.5% to +106.1% | $0.000140 to $0.000220 | +69.7% to +166.7% |
The base case expects a choppy range, since the line has just absorbed a very large drop and trading is thin.
The bull case needs steady buying that lifts the level above the morning shelf and holds it there. The bear case runs under the yearly floor and appears if sellers return before the chart stabilizes.
The 30-day bands for the BlockchainFX price are wider because depth a month out is harder to judge, and the 52-week range shows how far this market has moved before.
Downside Map: How Close the Yearly Floor Sits
Distance to the floor matters more once a quote has already fallen this far.
The floor of $0.0000381 sits about 53.8% under the latest quote.
A further 50% fall would put the figure near $0.0000413, only 8% above that floor.
A repeat of the same 61.75% loss would land near $0.0000316, about 17% beneath it.
Both bear ranges extend past the floor, so a break would set a fresh 52-week extreme.
Levels to Watch: $0.000047 Wick Bottom and $0.000105 Shelf
Support: the overnight low near $0.000078. A close beneath it reopens the wick bottom.
Wick bottom: the morning drop near $0.000047 was sharp and brief, so it is a weak guide alone.
Resistance: the flat shelf near $0.000105. A close above it would suggest the BlockchainFX price is stabilizing.
Working band: $0.000078 to $0.000105, so moves inside it say little on their own.
Turnover check: heavy trading on a bounce would carry more weight than a quiet drift upward.
Official Post Check and Risk Notes for the Coming Week
An X post dated Nov 10, 2026, from the official BlockFX account described access to a trading setup across laptop, tablet, and phone.
It carried no usage figures and no token supply details, so it adds no measurable input here.
A TVL of $3.7K against an FDV of $262.7K means a handful of orders can dominate a session, and the BlockchainFX price can swing by double digits in hours.
Conclusion
The read stays cautious and sideways-to-lower until the level holds above $0.000078 on steady trading. Two checks matter most this week: whether the overnight low survives another test and whether any bounce arrives with real turnover.
Anyone tracking BFX should compare timestamps, since a figure carrying a low confidence label can change between readings.
YMYL Disclaimer: This article is for informational and educational purposes only and should not be taken as financial or investment advice. Crypto markets are volatile, and details such as roles, plans, or figures mentioned here can change over time. Readers should do their own research before making any decisions based on this content.