Buy Signal on Bitcoin, Ethereum, and XRP: Is a Rebound Coming Next?


A buy signal on Bitcoin, Ethereum, and XRP just flashed after a rough day for crypto.
Bitcoin sank below $83,000. Ethereum lost its $2,600 support, and XRP is trading near $1.40.
The wider market sold off hard. Here is what the charts and the numbers show.
Why Did Bitcoin, Ethereum, and XRP Drop Today?
Bitcoin fell 5.55%, from $86,976 on October 5 to $82,150. On the four-hour chart, it later sat near $82,821.
Ethereum dropped 7.36%, from $2,738 to $2,537. XRP slid from $1.53 to $1.39.
Rate hike fears, high bond yields, ETF outflows, and forced selling all landed at the same time.
Crypto Price Snapshot: BTC, ETH and XRP
Coin | Recent Drop | Decline | Chart Price (4H) | Levels in Focus |
Bitcoin (BTC) | $86,976 to $82,150 | 5.55% | $82,821 | $83,000 support |
Ethereum (ETH) | $2,738 to $2,537 | 7.36% | $2,570 | $2,620, then $2,650 |
XRP | $1.53 to $1.39 | About 9.15% | $1.409 | Possible local low |
What Does the Buy Signal on Bitcoin, Ethereum, and XRP Mean?
The signal comes from the TD Sequential. It is a technical tool that traders use to spot price exhaustion and possible reversals.
Analyst Ali Martinez noticed a buy signal on Bitcoin's hourly chart right at the $83,000 support level.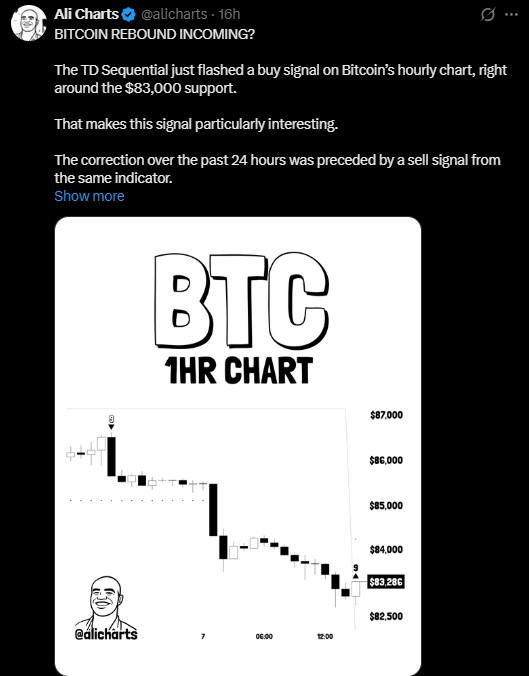
He added that the drop over the last 24 hours was preceded by a sell signal from the same indicator.
Later, the four-hour charts for Bitcoin, Ethereum, and XRP flashed buy signals too. Martinez said the pullback "may be nearing an end."
That is a clue, not a promise. Signals can fail.
Bitcoin Price Prediction: Will BTC Bounce From $83,000?
The bullish case is easy to explain. Bitcoin is at a support zone, and the indicator turned to buy at that spot.
Martinez posted a four-hour chart showing BTC near the $82,000 area. His message was "buy the dip."
The risk is just as clear. If $82,000 gives way, his chart shows the next visible level near $78,100.
On the upside, a bounce could bring BTC back toward $86,000, where the drop began. That is one path among many.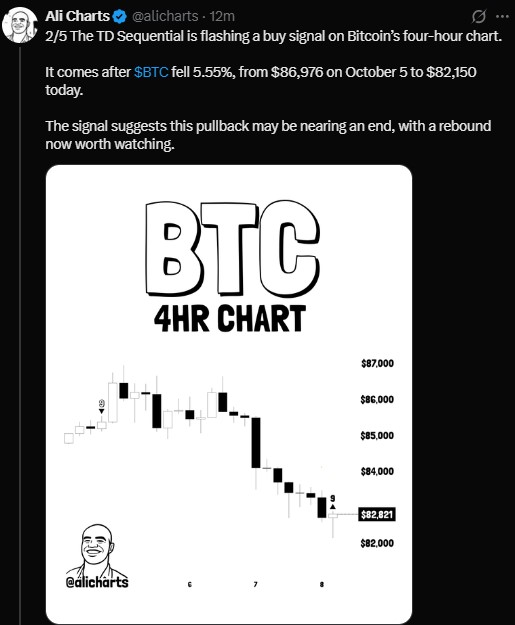
Ethereum Price Prediction: Can ETH Reclaim $2,600?
After the 7.36% fall, the four-hour TD Sequential flashed a buy signal on ETH.
Martinez said that if buyers confirm it, he is watching for a move to $2,620 and then $2,650.
ETH was near $2,570 on the chart. That is still under the $2,600 support it lost.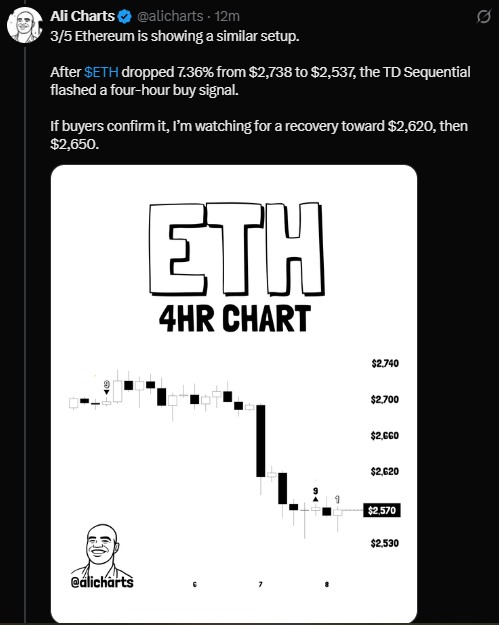
XRP Price Prediction: Is $1.39 the Bottom?
XRP also gave a four-hour buy signal after falling from $1.53 to $1.39.
An earlier sell signal lined up closely with XRP's local high. So the tool read that part well.
Now the question is simple. Does this new signal mark a local low? XRP trades near $1.409 for now.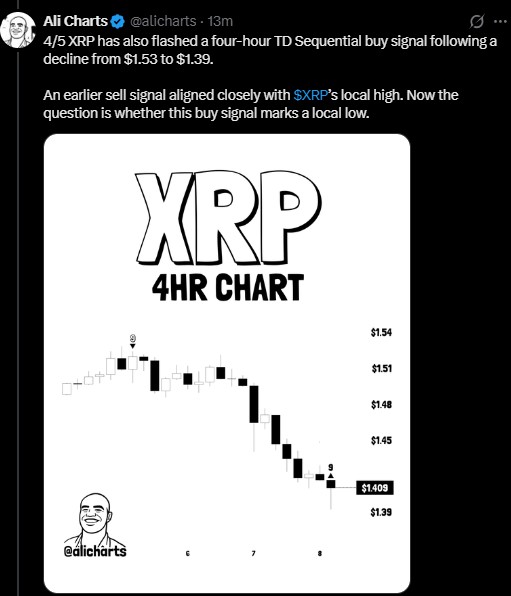
Are Bitcoin and Ethereum ETFs Losing Money?
Yes, on October 7. SoSoValue data shows U.S. spot Bitcoin ETFs had $487 million in net outflows.
BlackRock's IBIT led with $208 million in withdrawals.
Spot Ethereum ETFs saw $161 million in net outflows. BlackRock's ETHA made up $116 million of that.
XRP had a flat session, with no big fund selling reported.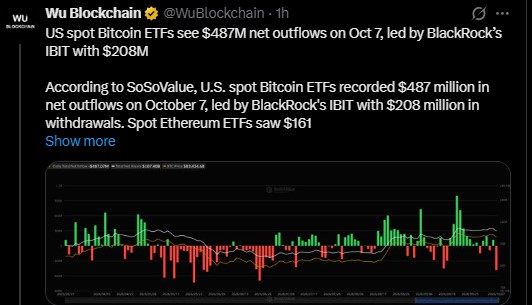
Will the Fed Raise Interest Rates Again?
Minutes from the September meeting showed the Fed united on raising rates. Officials leaned toward another hike by year-end.
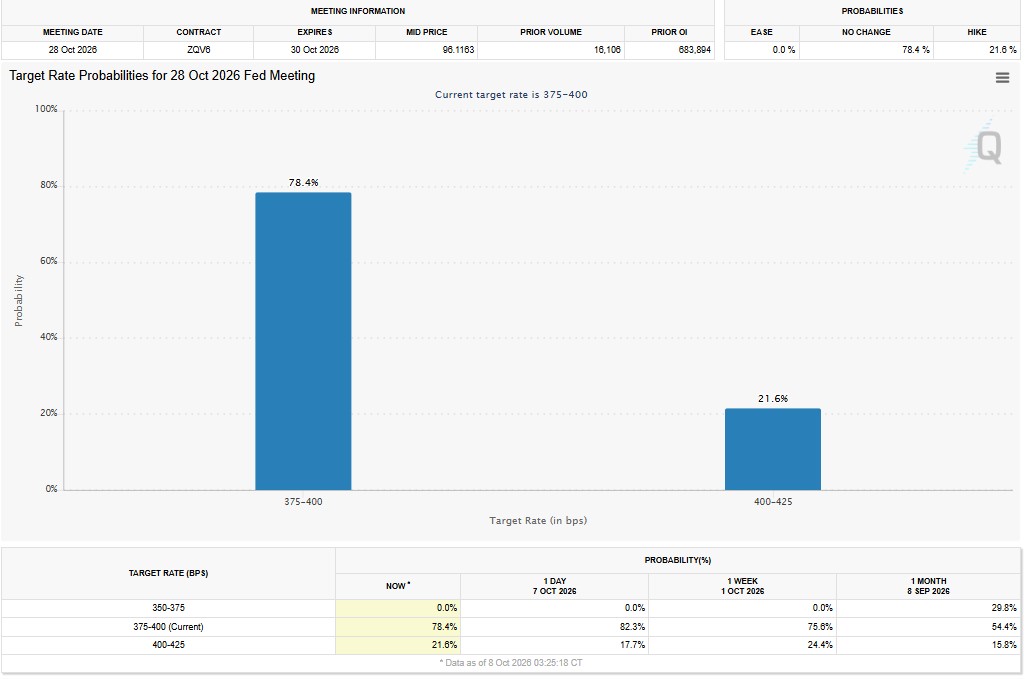
The current target range is 3.75% to 4.00%. CME FedWatch shows these odds:
Fed Meeting | No Change | Rate Hike |
October 28 | 78.4% | 21.6% |
December | Not shown | Over 67.60% |
Bond yields are high as well. The 10-year Treasury yield rose to 5.36%, the highest since April 2002. The 30-year yield jumped to 5.73%.
Higher yields can pull money away from risk assets like crypto.
Is the Crypto Market Still Greedy? Fear and Greed Index Today
The Fear & Greed Index reads 64, which is still Greed.
Period | Score | Mood |
Now | 64 | Greed |
Yesterday | 71 | Greed |
Last week | 74 | Greed |
Last month | 69 | Greed |
Sentiment is cooling but still upbeat. Some traders think that leaves room for more fear before a clean bottom forms.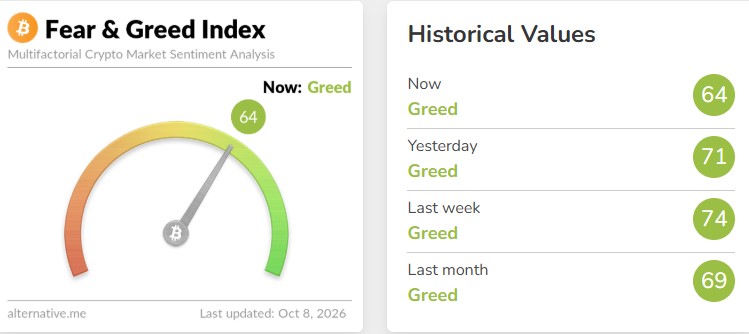
How Much Crypto Was Liquidated in the Last 24 Hours?
CoinGlass data shows 94,582 traders were liquidated. Total losses reached $417.47 million.
Longs lost $362.36 million. Shorts lost $55.11 million.
Time Frame | Total Liquidations |
1 hour | $3.99 million |
4 hours | $23.21 million |
12 hours | $153.57 million |
24 hours | $417.47 million |
Bitcoin led with $119.78 million, then Ethereum with $104.10 million. ZEC had $19.35 million, and SOL had $17.94 million.
The largest single order was $11.82 million on Binance in BTCUSDT.
A flush like this sometimes comes before the kind of bounce a buy signal on Bitcoin, Ethereum, and XRP points to. Sometimes it does not.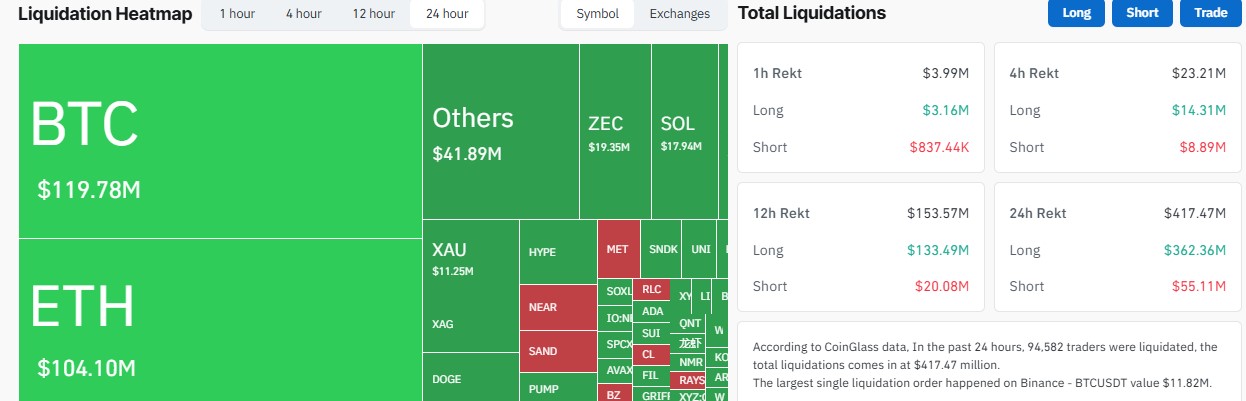
What Should Crypto Traders Watch Next?
For Bitcoin, the $83,000 and $82,000 areas matter most. For Ethereum, watch $2,600 and the $2,620 to $2,650 zone. For XRP, watch whether $1.39 holds.
Bulls have a signal, a support level, and a market that already cleared many leveraged longs.
Bears have rate hike risk, high yields, and steady ETF outflows.
Nobody can say how this plays out. A buy signal on Bitcoin, Ethereum, and XRP is only one input, and the December Fed meeting may matter more.
Disclaimer
This article is for information only. It is not financial, investment, or trading advice. Cryptocurrency prices are volatile, and you can lose some or all of your money. Technical signals like the TD Sequential can be wrong. Do your own research and speak with a licensed financial advisor before making any decision.












.webp)




