Canton Price Prediction November 2026: Can CC Reclaim $0.14553?


Will CC bounce from its last support level, or has the slide only started?
Canton price prediction November 2026 starts with one floor and one moving average. Canton Coin trades near $0.096 on Oct 31, 2026, 11:20 AM UTC. The coin has lost 23.89% over 30 days.
Buyers defend $0.09043, while the 50-day EMA sits at $0.10966. The Canton Network ecosystem guide covers the wider network.
Canton 24-Hour Market Data
| Metric | Value |
| Price | $0.096 |
| Market cap | $3.835B |
| FDV | $3.835B |
| 24h trading volume | $14.736M |
| Perps open interest (24h) | $48.663M |
Source: CoinGecko market data, Oct 31, 2026, 11:20 AM UTC.
CoinGecko market data puts $CC at $0.096 inside a 24h range of $0.09434 to $0.09904.
FDV matches the $3.835B market cap. So no locked supply waits to hit the market.
Daily trading volume is $14.736M, thin against a $3.835B cap.
Canton Uber News: On-Chain liquidity
On-chain liquidity and settlement mean raising cash from holdings through a blockchain instead of slower bank channels. Per the official Canton Network post on X, Uber completed a first-ever pilot of that solution on Canton, a public network.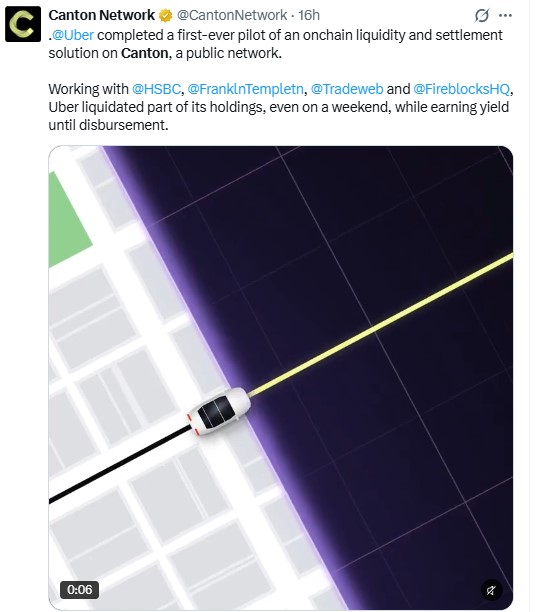
Source: X, Oct 31, 2026, 11:20 AM UTC.
The post names HSBC, Franklin Templeton, Tradeweb, and Fireblocks as partners. Uber sold part of its holdings over a weekend and kept earning yield until payout.
The Canton Uber news was about 16 hours old at capture, and the price hasn't reacted. $CC gained just 0.22% over 24h, per CoinGlass.
If more institutions repeat the pilot, transfers and burns could rise. If not, the daily chart keeps driving price.
CC Price performance Data
Per CoinGlass price data as of Oct 31, 2026, 11:20 AM UTC, $CC gained 0.17% over 4h and 0.22% over 24h. The 7d change is -5.11%.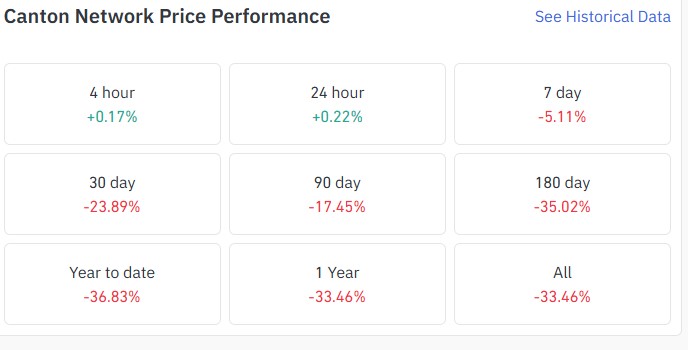
Source: CoinGlass, Oct 31, 2026, 11:20 AM UTC.
The 30d loss is 23.89%, which implies a price near $0.126 a month ago.
A 0.22% daily gain barely dents those numbers. And bounces have faded each time since October.
Canton Network Activity: Fewer Addresses, Higher Burns
CantonScan network data shows 36,663 active addresses (wallets that did something on-chain), down 13.01% in 24 hours. Total $CC transfers fell 7.62% to 146,189.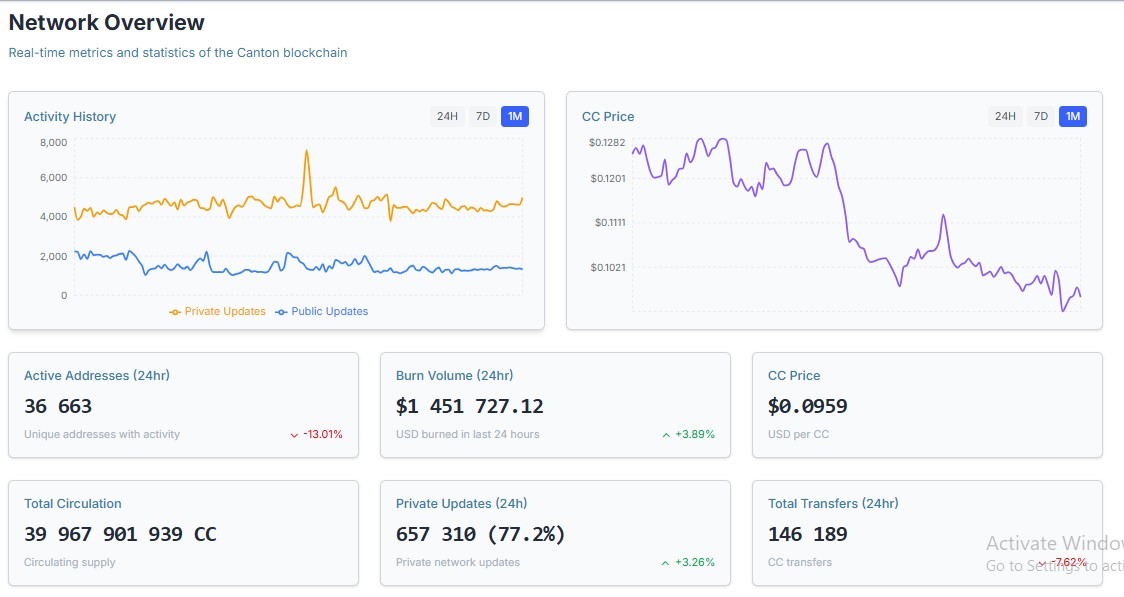
Source: CantonScan, Oct 31, 2026, 11:20 AM UTC.
Burn volume (the value of CC permanently removed from supply) reached $1,451,727.12, up 3.89%. Private updates (transactions kept out of public view) hit 657,310, or 77.2% of all updates.
Fewer active wallets means less fresh demand for $CC. Higher burns remove supply, but $1.45M is small beside a $3.835B cap.
CC Open Interest and Futures Volume: Binance Leads
Open interestopen interest guide(the total value of futures contracts still open) sits at $48.663M, per CoinGecko perps data as of Oct 31, 2026, 11:20 AM UTC. Rising open interest means new money is entering.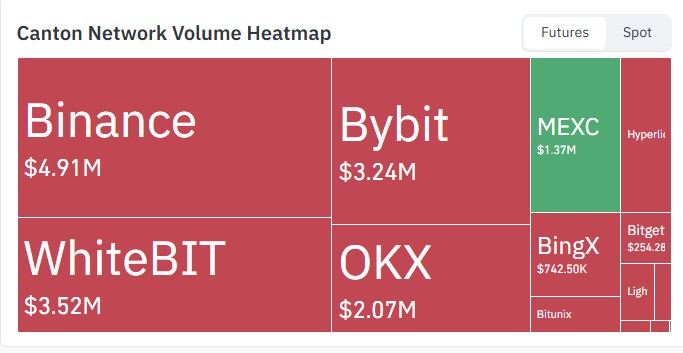
Source: CoinGlass, Oct 31, 2026, 11:20 AM UTC.
On the CoinGlass futures heatmap, Binance leads with $4.91M. WhiteBIT follows at $3.52M, a gap of $1.39M.
Bybit trades $3.24M and OKX $2.07M. The leader's order book tends to set the pace for $CC futures moves.
Canton Price Prediction November 2026: Catalysts to Watch
Follow-up announcements from the named partners would extend the Uber pilot story. Updates appear in the latest crypto news feed.
Canton Technical Analysis: Channel, 50-Day EMA, and RSI
TradingView data for CC/USDT on the OKX 1D chart frames the Canton price prediction November 2026 setup, captured Oct 31, 2026, 11:20 AM UTC.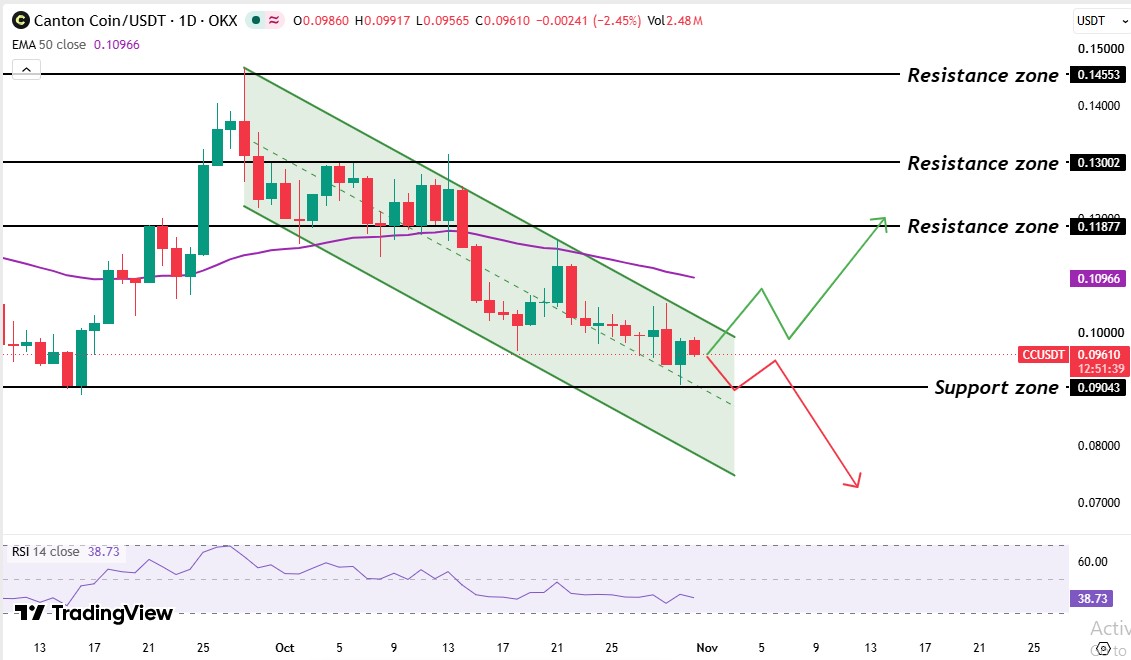
Source: TradingView, Oct 31, 2026, 11:20 AM UTC.
CC consolidated in mid-September below $0.10. After that price took $0.09043 support and did a breakout and crossed the 50 EMA level, then the price peaked at $0.14553 in late September.
But sellers defended that level, and the price started a downward trend, and also in early October the price consolidated between the $0.13002 and $0.11877 levels and finally broke the 50 EMA support and the $0.11877 level too on 13 October.
Price started going downward by making lower highs and lower lows, then forming a descending channel.
The 50-day EMA at $0.10966. Price trades below it, so the average acts as a ceiling for CC resistance levels.
RSI reads 38.73. Below 50 shows sellers in control, and above 30 means CC isn't oversold, so a bounce isn't guaranteed.
The earlier CC warming up forecast covers the prior setup.
CC Support Levels and Resistance Levels
| Type | Level |
| Support | $0.09043 |
| Resistance (50-day EMA) | $0.10966 |
| Resistance 1 | $0.11877 |
| Resistance 2 | $0.13002 |
Support levels are prices where buyers have stepped in, and resistance levels are where sellers have. The nearest support is $0.09043. The 50-day EMA at $0.10966 is the nearest resistance, with the channel top near $0.10 below it.
Canton Bull, Base, and Bear Scenarios
| Scenario | Trigger | Target | Invalidation |
| Bull | Daily candle trades above $0.10966 | $0.11877 | Back under $0.10 |
| Base | Range between support and 50 EMA | $0.09043 to $0.10966 | Candle outside either edge |
| Bear | Daily candle trades below $0.09043 | Channel Trendline | Back above $0.09043 |
The base case carries the most weight while RSI stays under 50.
a regulatory delay for tokenized finance, thin volume, and a break below $0.09043.
Canton price prediction November 2026: Expert Outlook
As per CoinGabbar analysis, the Canton price prediction November 2026 stance is cautiously bearish, while the price trades under the 50-day EMA at $0.10966. The Uber pilot shows bank partners will test Canton. But active addresses fell 13.01%.
A daily candle that trades above $0.10966 would be the first sign that buyers have beaten the downtrend.
Disclaimer: This article is for information only and isn't financial advice. Traders should do their own research and risk only what they can afford to lose.