Cardano Price Prediction: Why Is ADA Down Today After Record Spike?


Cardano is trading near $0.239 after a 6.08% drop in 24 hours. The coin slipped even as the network posted its busiest stretch ever.
ADA now sits just below $0.24, a level the channel was using as support. Traders want it back above that line.
Here is what the charts and on-chain data show.
What Is the ADA Price Today?
Metric | Value |
Price | $0.2394 |
24-hour change | -6.08% |
Market cap | $8.76B |
Circulating supply | 36.80B ADA |
Total supply | 44.99B ADA |
Max supply | 45.00B ADA |
Spot volume (24h) | $112.70M |
Futures volume (24h) | $689.66M |
Why Is Cardano Down Today Despite Record Activity?
The drop came right after a record. ADA processed 1,780,896 transactions in epoch 660, which ran from October 6 to 11, 2026.
An epoch is a fixed five-day period on the chain. Epoch 659 had 158,011 transactions, so the jump is 11.3 times. The network packed them into 21,243 blocks.
The old high from November 2021 sits 13.7% below this one. Epochs 653 to 657 stayed between 89,353 and 130,442. So this is one sharp spike, not a trend.
Price did not follow. ADA fell about 5.3% over the same period. More network load did not bring more buyers.
Many reports blamed governance votes. The count does not support that. Only 148 votes were recorded on the fee proposal.
The data points to many small, simple transfers with an average fee of 0.19 ADA. That looks more like a token campaign.
Network data | Number |
Transactions in epoch 660 | 1,780,896 |
Transactions in epoch 659 | 158,011 |
Jump vs. previous epoch | 11.3x |
Epochs 653 to 657 range | 89,353 to 130,442 |
Previous record (Nov 2021) | 13.7% lower |
Blocks in epoch 660 | 21,243 |
Average fee | 0.19 ADA |
Governance votes on the proposal | 148 |
The proposal to cut the minimum stake pool fee from 170 ADA to 75 ADA failed. Staking rewards stay as they are.
German holders should know that staking income is taxable there. Keeping ADA on an exchange also limits your voice in governance.
Are Whales Dumping ADA? 110M Coins Gone in 5 Days
It looks that way. Large holders sold more than 110 million ADA over the past five days.
Whale holdings fell from about 2.87 billion ADA to roughly 2.75 billion ADA, based on the Santiment chart shared by Ali.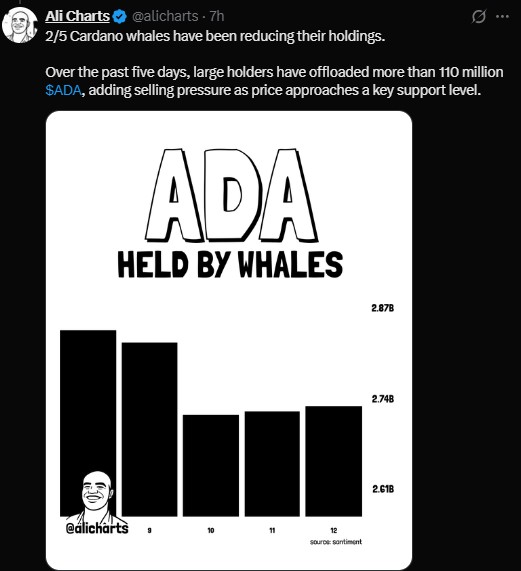
User activity is fading too. Daily active addresses dropped 41.36%, from 27,248 to 15,977.
Less activity and whale selling is a weak mix, especially when price sits just under a key level.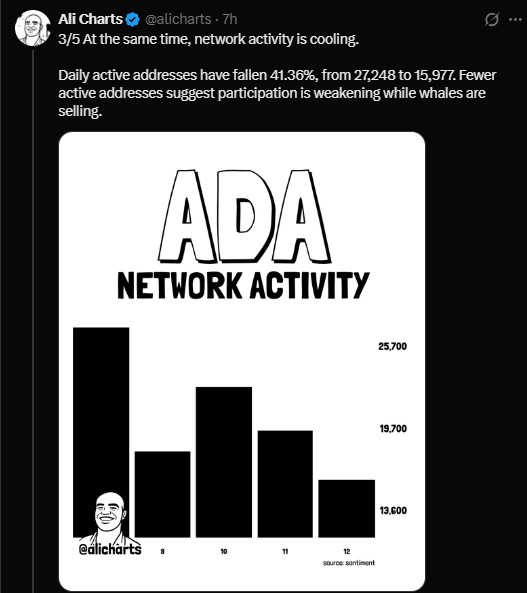
Is ADA Bullish or Bearish? Long Traders Lose $4.32M
Derivatives metric | Value |
Futures volume | $690.07M (+60.53%) |
Open interest | $523.43M (-4.75%) |
Options volume | $6.59K (-92.94%) |
Options open interest | $374.92K (-0.27%) |
Total liquidations (24h) | $4.45M |
Long liquidations | $4.32M |
Short liquidations | $131.86K |
Long/short ratio (24h) | 0.8612 |
Binance accounts long/short | 1.9223 |
OKX accounts long/short | 2.36 |
Binance top traders (accounts) | 2.3829 |
Binance top traders (positions) | 1.9848 |
Short-term momentum leans bearish. Price is falling, open interest is down, and longs took most of the pain.
About $4.32M of the $4.45M in 24-hour liquidations came from longs. In the last 12 hours, liquidations were $3.19M.
Open interest fell while volume jumped. That can point to traders closing positions instead of opening new ones.
Sentiment is mixed. The 24-hour ratio is 0.8612, but the Binance and OKX ratios sit well above 1.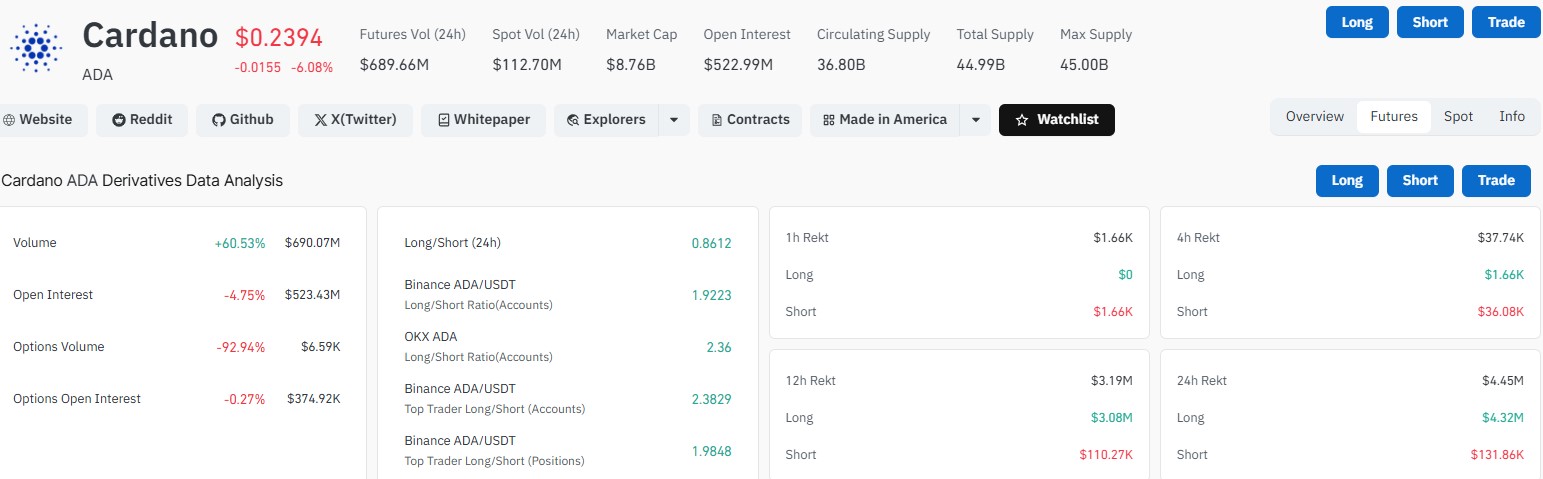
ADA Support and Resistance Today: Can ADA Reclaim $0.24?
ADA has moved inside a rising channel on the daily chart since June. The upper edge sits near $0.28 to $0.29. The lower edge is near $0.21.
Price is now just under the middle of that channel.
Level | Type | Note |
$0.29 | Channel top | Upper line on the Ali Charts view |
$0.28 | Resistance | Recent rejection zone |
$0.2440 | EMA 20 | Short-term average, now above price |
$0.2410 | EMA 200 | Long-term average, price near it |
$0.24 | Key level | Channel support in focus, price sits just below |
$0.2303 | EMA 50 | First support below price |
$0.2194 | EMA 100 | Deeper support |
$0.21 | Channel floor | Lower boundary of the channel |
RSI sits at 49.14, which is neutral. Its moving average is 56.93, a bit higher, so momentum has cooled.
Will ADA Go Up or Down? Bull and Bear Scenarios
Scenario | What needs to happen | Levels to watch |
Bullish | ADA holds $0.23 and wins back $0.24 | $0.25 to $0.26, then $0.27 to $0.28 |
Bearish | Daily close below $0.23 | $0.22, then $0.21 |
Breakout | Daily close above $0.28 | Trend would look stronger |
These are possible paths, not promises. The channel still slopes up, with higher highs and higher lows.
But whale selling, fewer active addresses, and heavy long liquidations add risk. A few more daily closes should show which side is winning.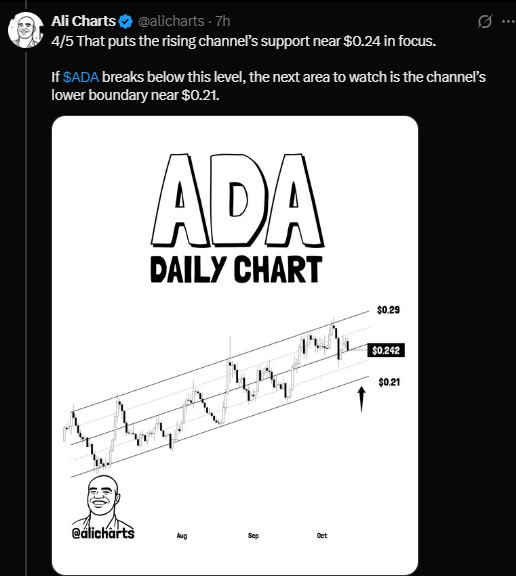
Is ADA a Good Buy Right Now?
Nobody can say for sure. Bulls point to the rising channel and the record network count. Bears point to whale sales and weak activity.
The record did not lift price, so it is not a clear buy signal alone.
Do your own research before making any move. Only risk money you can afford to lose.
Disclaimer
This article is for information only. It is not financial, investment, or tax advice. Crypto is volatile, and you can lose all of your money. Price predictions are opinions based on past data and cannot guarantee future results. Always do your own research and speak with a licensed financial advisor before you invest.

















