Chainlink Price Prediction: Can Open USD News Push LINK To $21.50?


Chainlink price prediction searches are heating up, and $LINK has just handed traders a reason to pay attention.
A fresh headline tied to some of the biggest names in global payments has landed, and the chart is sitting at a moment of truth. Is this the setup that finally wakes LINK up? Read on.
Editorial disclosure: the CoinGabbar desk holds no personal position in $LINK. This is a pure chart and data read, not a trade call.
Chainlink Price Today: Live LINK Price, Market Cap and Volume Data
$LINK is changing hands at $14.406, down 0.58% on the day. Market cap sits at $10.80B. Open interest, the total value of unsettled futures contracts, is $759.74M.
Futures volume over 24 hours is $555.30M, while spot volume is $118.20M. Circulating supply is 748.09M $LINK out of a 1.00B total and max supply.
Source: CoinGlass, Oct 2, 2026.
Chainlink News Today: Open USD Oracle Selection Boosts LINK Outlook
An X post from ALLINCRYPTO (@RealAllinCrypto), about 18 hours old, says Chainlink has been picked as an official data oracle for Open USD (OUSD). 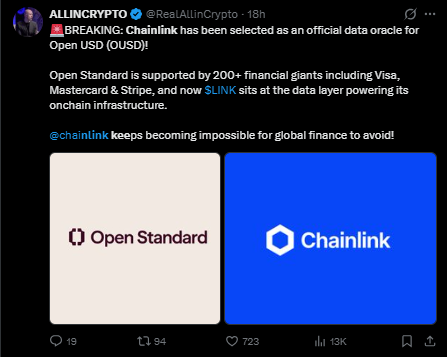
The post adds that the open standard behind it is backed by 200+ financial firms, including Visa, Mastercard, and Stripe, and that $LINK now sits at the data layer of its on-chain infrastructure.
It is a social media claim, so treat it as a headline to verify, but for Chainlink news today it carries real weight: oracles are exactly what a payments-grade stablecoin needs to price assets reliably.
Source: X post by @RealAllinCrypto, Oct 2, 2026.
Chainlink Price Forecast Quick Take: Key LINK Levels to Watch Now
CMP: $14.412
Trigger: 1-hour close above $15.780
Failure level: 1-hour close below $13.479
Data timestamp: Oct 2, 2026, 09:40 IST
Risk note: Triangle breakouts on short timeframes fake out often, so wait for closes.
Chainlink Price Prediction Technical Analysis: LINK Triangle Setup
Method: 1-hour LINK/USDT chart on Binance, symmetrical triangle, chart-marked oscillator reading of 52.22. Invalidation: 1-hour close below $13.479.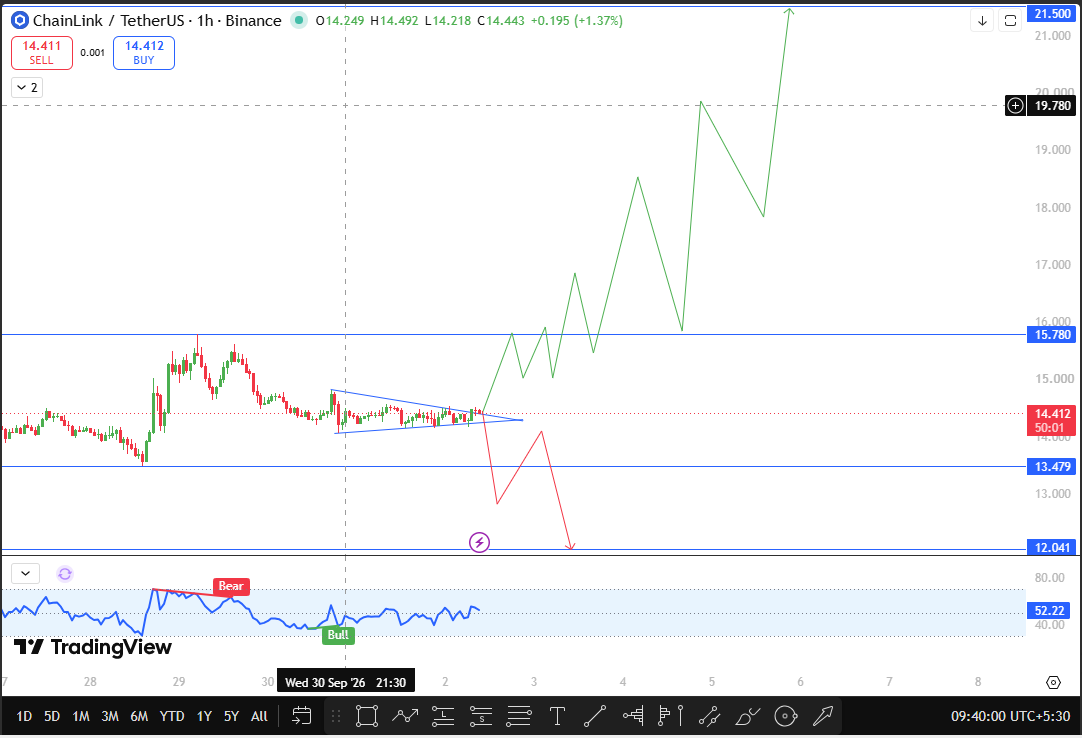
Since Sep 30, Price has been squeezing into a tightening symmetrical triangle, with lower highs and higher lows pressing price toward the apex.
It has now attempted a breakout above the upper trendline and, so far, is sustaining above it instead of dropping straight back in. That matters, because failed attempts usually reverse fast.
The line that changes the picture is $15.780. A 1-hour close above it confirms the breakout and flips the structure bullish, with the chart projecting a staircase of higher highs toward the major resistance at $21.500. A chart-marked level at $19.780 sits along that route.
The oscillator reads 52.22, a neutral reading with room to run in either direction. The chart carries a bear divergence label near the Sep 29 highs and a bull label near the recent lows.
The downside trigger is $13.479, and a 1-hour close under it points to $12.041. This LINK price forecast hinges on those two closes.
Source: TradingView, LINK/USDT 1H, Binance, Oct 2, 2026, 09:40 IST.
LINK Support and Resistance Levels: Chainlink Price Target Zones
Level | Role | Distance from CMP |
$21.500 | Major resistance | +49.18% |
$19.780 | Chart-marked resistance | +37.25% |
$15.780 | Breakout trigger | +9.49% |
$14.412 | CMP | 0% |
$13.479 | Breakdown trigger | -6.47% |
$12.041 | Next support | -16.45% |
Chainlink Price Outlook: Bull, Base, and Bear LINK Forecast Scenarios
Bull case. Buyers push a 1-hour close above $15.780, and the triangle breakout stops being an attempt and becomes a fact. From there the chart points to $19.780, then $21.500, a move of roughly 49% from here. News flow around Open USD would give that run a story to lean on.
Base case. The breakout attempt stalls, and $LINK keeps grinding sideways between $13.479 and $15.780. Triangles that run out of room tend to resolve soon, so this phase will not last long. Patience pays here more than prediction.
Bear case. The breakout turns out to be a trap. Price slips back through the triangle, closes under $13.479, and sellers aim for $12.041, about 16% below the CMP.
Chainlink Price Risks: What Could Invalidate This LINK Breakout
Short timeframe patterns break often, and a single wick can fool a chart. The Open USD story rests on one X post, so confirmation from official channels matters.
Futures volume far outweighs spot volume, which means leveraged positions can force sharp moves either way. Macro shocks can override any pattern.
Chainlink Technical Analysis Glossary
CMP: the latest price marked on the chart.
Symmetrical triangle: a pattern of lower highs and higher lows that usually ends in a breakout.
Oscillator: an indicator that tracks momentum on a bounded scale.
Disclaimer: Not Financial Advice Notice
This article is for information only and is not financial, investment, or trading advice. Crypto assets are volatile, and you can lose your entire capital. Do your own research before making any decision.












.webp)








