Chainlink Price Prediction: Will LINK Hold $10 After Schwab?


Did Schwab open the door for Chainlink, or are buyers still waiting outside?
LINK trades at $10.07 on Binance at 10:40 UTC on November 12, 2026, down 2.67% in 24 hours.
That's the starting point for this Chainlink price prediction today, and the price sits barely above the $10 floor. The drop extends an earlier oversold breakdown.
Chainlink Price Analysis and Live Market Data
CoinMarketCap data puts market cap at $7.53B, with $247.55M in 24-hour volume, up 1.77%. Chainlink ranks #14.
Circulating supply is 748.09M LINK out of 1B, so about 25% of tokens haven't entered the market. Volume to market cap sits at 3.29%, which is thin.
The 24-hour range ran from $10.02 to $10.56. LINK still trades 80.92% under its $52.88 all-time high.
Chainlink Technical Analysis From Start to Now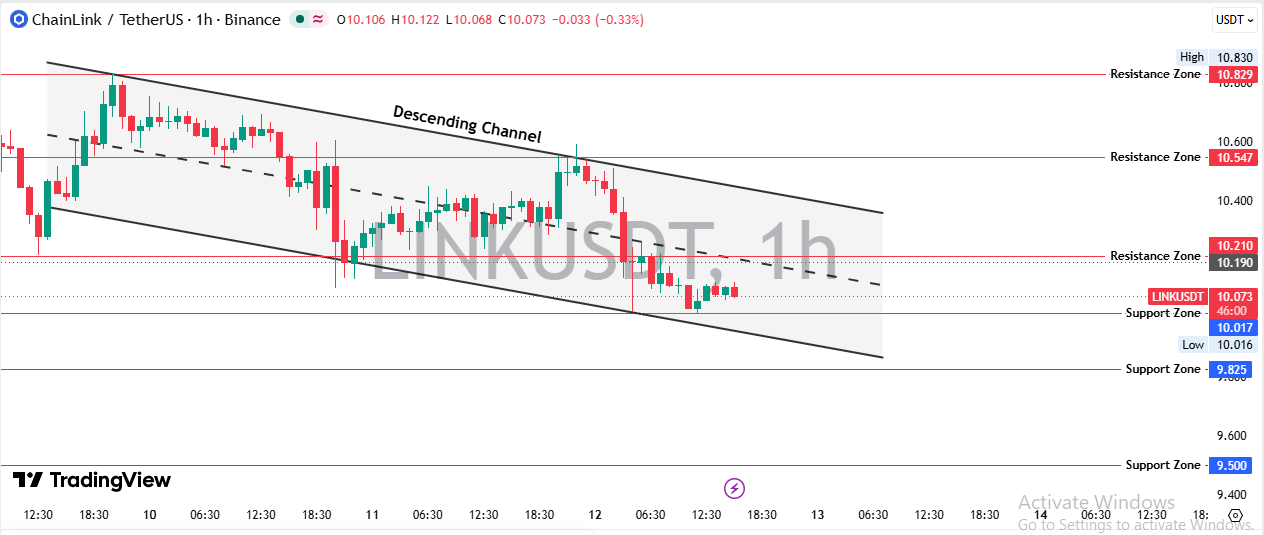
Price Action From $10.83 to $10.07
This Chainlink technical analysis follows the hourly chart on Binance from its first candle. It opens with a push from near $10.25 to a $10.83 high on November 9, 2026. Buyers couldn't repeat it.
Every bounce after that topped out lower. A descending channel, a pair of parallel lines sloping down that hold price between them, formed around those lower highs and lower lows.
The price reached the channel roof near $10.58 on November 11, 2026. Sellers rejected it fast.
Then a big red hourly candle on November 12, 2026 dragged LINK to $10.02, the day's low. Two bounces since then stalled under $10.21. That's a weak bounce. Actually, calling it a bounce gives it too much credit.
The price now trades at $10.07, near the channel floor.
Support and Resistance Levels
LINK support and resistance are easy to mark here. Support, the zone where buyers usually step in, sits at $10.02, $9.83 and $9.50.
Resistance, where sellers usually show up, stacks at $10.21, $10.55 and $10.83. An earlier channel breakout near $12.47 now feels far away.
If $10.02 gives way, and volume backs it, then $9.83 is next.
Chainlink Price Outlook After Schwab Access
Charles Schwab opened Chainlink trading to its crypto clients earlier this week. LINK posted a 30-day low the next day.
That's the adoption priced in argument playing out. Good news arrived, and sellers used it.
ETF Flows Stay Flat
Latest SoSoValue ETF data shows cumulative net inflows near $176.4M, below the earlier high of $179.6M. Fund holdings fell from $230.1M to about $180.2M.
Most days show zero flow. So who's actually buying?
Chainlink Reserve Buying Isn't Enough
The Reserve is Chainlink's programme that buys LINK with network fees. Earlier price action around it sits in the Reserve buy bounce piece.
But Reserve buying hasn't stopped LINK from sliding to $10.07.
Chainlink Futures and Holder Data
Futures Positioning
CoinGlass data shows open interest, the total value of open futures contracts, at $461.49M, down 3.31%.
Futures volume fell 14.18% to $382.31M. Spot volume dropped 11.03% to $69.68M.
Spot net flow turned negative by $1.4M, and futures lost $27.0M. And that's the answer to who's buying. Few are.
Liquidations and Funding
Longs got hit. Liquidations reached $925.32K in 24 hours. 97% were longs.
The funding rate, a fee longs pay shorts when buyers dominate futures, is still positive at 0.0052%, or 5.7% annualised. But only just. Fear and Greed shows 29, a fear zone.
For context on how longs behaved in an earlier wedge, see the falling wedge longs analysis.
Holder Map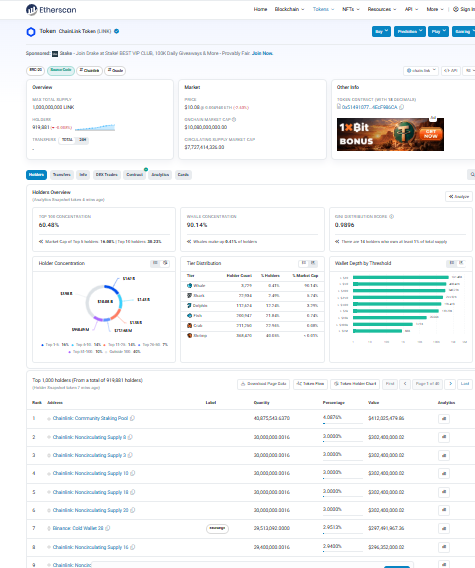
Etherscan holder data shows the top 6 holders are Chainlink-labeled wallets. 5 are noncirculating supply wallets holding 30M LINK each, or 3.00% of supply.
Binance Cold Wallet 28 comes next with about 29.5M LINK. Dump risk from the biggest wallets is smaller than raw rankings imply.
Chainlink Price Forecast and Scenario Table
This Chainlink price prediction maps 3 paths from $10.07.
Scenario | Trigger | Target | Invalidation | Liquidity Condition |
Bullish | Hourly trade above $10.21 | $10.55, then $10.83 | Trade back under $10.02 | Spot inflows positive, volume above $247.55M |
Base | Trades hold $10.02 to $10.21 | $10.02 to $10.21 range | Break of either edge on rising volume | Volume near $247.55M |
Bearish | Hourly trade under $10.02 | $9.83, then $9.50 | Reclaim of $10.21 | Long liquidations, thin bids |
Bullish Scenario
A bullish path starts with an hourly trade above $10.21. That level capped the bounce on November 12, 2026.
Clearing it opens the channel roof near $10.55, then $10.83, about 7.5% above $10.07. Spot flows would need to turn positive for that to hold.
Base Scenario
Sideways trading between $10.02 and $10.21 fits thin volume and flat ETF flows. That's a range just 1.9% wide.
And a range that tight rarely lasts.
Bearish Scenario
Bears have the edge. An hourly trade under $10.02 sends LINK toward $9.83, 2.4% lower, then $9.50, 5.7% lower.
And large wallet deposits to exchanges would add pressure. For wallet context, the whale holders analysis covers earlier large-holder data.
Chainlink Price Prediction and Final Levels
A previous November market dip forecast framed $11.10 as support. The price already broke it.
Bears hold control. This Chainlink price prediction stays bearish below $10.21, with $9.83 as the next floor. A reclaim of $10.55 would change that.
Disclaimer: This article is for information only and isn't financial advice. Crypto prices are volatile, and targets aren't guaranteed. Research independently before trading.