Chainlink Price Prediction: Can LINK Reclaim $12.21 After Dip?


Did Chainlink just buy the bottom while the chart was still printing it?
Price tagged $11.55 in the last 24 hours, then snapped back. Another $1.1M of LINK also went into the reserve, and DTCC's name surfaced again, as earlier DTCC coverage tracked.
That mix drives today's Chainlink price prediction. Buyers showed up. But the descending channel hasn't broken, and that matters more.
Chainlink Price Today: Bounce From the Channel Floor
Price and 24H Range
The Chainlink price today is $12.09, up 0.92% in 24 hours, per CoinMarketCap live data. Data Oct 19, 2026, 06:22 UTC. The range runs from $11.55 to $12.22. The LINK price today sits near the top of that 5.8% swing.
Volume and Market Cap
Volume rose 22.15% to $233.51M, and market cap holds at $9.04B, rank 13. An earlier ETF stall report flagged thin trading. Rising volume beats a bounce on air.
Supply and FDV
Circulating supply is 748.09M of 1B LINK, leaving 251.91M outside circulation, as the LINK staking update covers.
Latest Previous Prediction: Target vs. Actual Result
The Fulcrum price report leaned bearish, and the tape agreed.
Target | Condition | Actual Move | Status |
$11.829 | Trading under $12.18, due by Oct 24, 2026 | 24H low of $11.55 | Hit |
$11.463 | Break of $11.829 | Binance low of $11.531 | Not Hit |
$13.056 | Reclaim of $12.562, due by Oct 22, 2026 | 24H high of $12.22 | Not Hit |
$12.18 to $12.433 range | Chop for two to three days | $12.18 lost | Not Hit |
Support at $12.18 gave way first. Bearish scenario as a whole: Partially hit.
Chainlink News Today: Reserve Buys Again
Reserve Purchase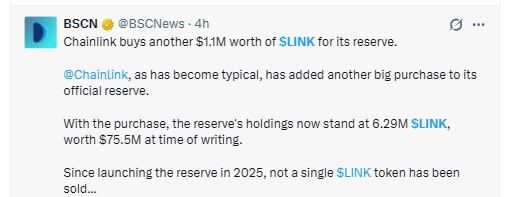
Chainlink news today starts with a buy. Chainlink added another $1.1M of LINK, per BSCN's X post, about four hours before Oct 19, 2026, 06:22 UTC.
The reserve now holds 6.29M LINK, worth $75.5M. Not one token sold since 2025. Is $1.1M enough to move a $9.04B asset? Not alone.
Sibos Stage
Sergey Nazarov joined DTCC's Nadine Chakar at Sibos, per Chainlink's X post, roughly nine hours before that same timestamp. A stage talk isn't a product launch.
Chainlink Technical Analysis: Channel Midline Test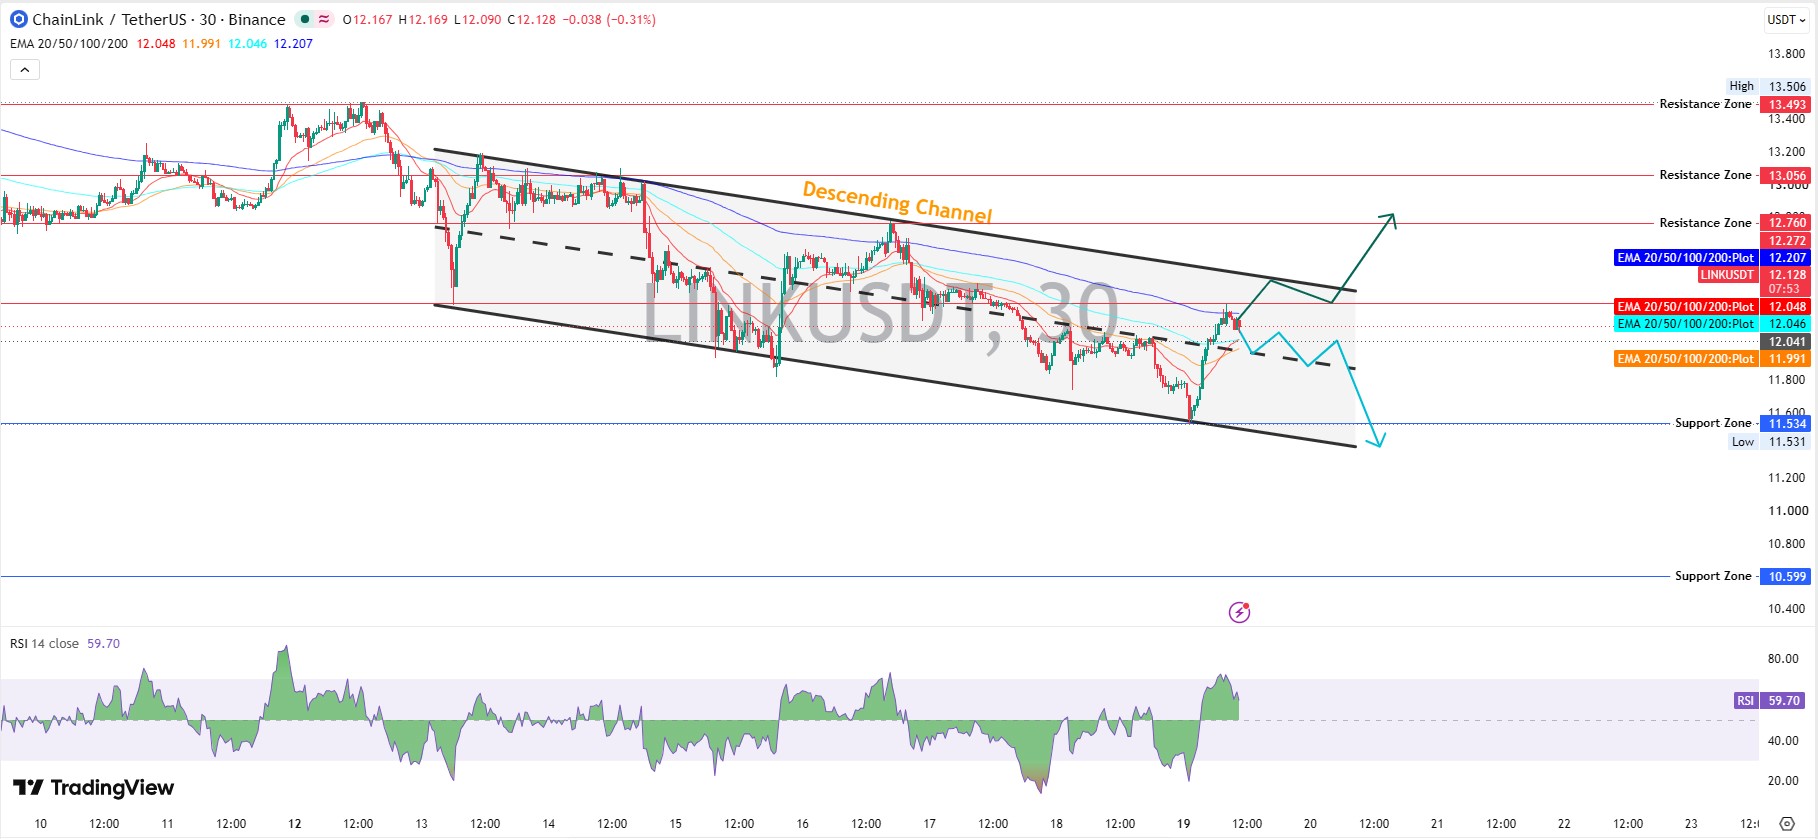
Chainlink technical analysis on the 30-minute Binance chart shows a descending channel, per TradingView chart data. Descending channels print lower highs and lower lows. Price bounced near $11.53 and trades at $12.128, near the midline.
The 20 EMA, 50 EMA, 100 EMA, and 200 EMAs read $12.048, $11.991, $12.046, and $12.207. Price trades above three of them. But the 200 EMA still sits overhead.
RSI reads 59.70 after dipping below 30. That reads bullish. Then again, bounces inside downtrends often stall at the midline. Bias stays bearish while LINK trades under $12.207.
Key Support Levels
LINK support and resistance start below, at $12.048. Then $11.534, about 4.6% lower, and $10.599, about 12.3% lower. Earlier tests sit in the CPI selloff support report.
Key Resistance Levels
Overhead supply stacks up: $12.207 (200 EMA) about 1.0% higher, then $12.760 at 5.5%, $13.056 at 8.0%, and $13.493 at 11.6%.
Chainlink ETF Flows: Latest Print
Chainlink ETF flows turned negative on Oct 16, 2026, with a $397.26K net outflow, per SoSoValue ETF data. Data covers the U.S. session ending 20:00 UTC. That's the newest print, since markets shut on weekends. Net assets stand at $217.41M, 2.36% of market cap.
Grayscale vs Bitwise
Two funds, two directions. GLNK lost $1.96M while CLNK gained $1.56M, a split that follows the earlier record ETF inflow headline. 30-day net inflow still reads $27.04M.
LINK Derivatives: Longs Paid for the Dip
Futures volume is $337.59M against $51.67M in spot, per CoinGlass derivatives data, Oct 19, 2026, 05:00 UTC. Open interest, the value of open futures contracts, sits at $580.69M, down from $593.13M on Oct 17.
Liquidations, meaning forced exits, reached $1.41M in 24 hours. Longs took $1.36M. Binance accounts lean long at 1.5164. If the price loses $11.534. Then crowded longs fuel the drop.
Holder Data: Whales Trimmed, Holders Grew
Holder Count
Holders reached 916,772 from 916,106 on Oct 17, and the wallet count trend keeps climbing.
Whale Concentration
Whales, meaning very large wallets, number 4,169 per Etherscan holder data, down 12 since Oct 17. They're 0.45% of holders yet hold 90.70% of market cap. The top 100 wallets control 61.45%. Not every giant is a seller.
Chainlink Price Prediction Scenarios
Scenario | Trigger | Target | Invalidation | Liquidity Condition |
Bullish | Trading above $12.207, then $12.760 | $12.760, then $13.056 | Trading under $12.048 | Volume above $233.51M, open interest rising |
Base | Chop between $12.048 and $12.207 | Range holds | Trades beyond either level | Volume near $233.51M |
Bearish | Trading under $11.991, then $11.534 | $11.534, then $10.599 | Reclaim of $12.207 | Long liquidations above $1.36M, ETF outflows |
Chainlink Price Forecast for October 2026
Bull Case
Trading above $12.760 on rising volume could open a LINK price target of $13.056, then $13.493, by Oct 31, 2026, 23:59 UTC. Trading under $12.048 cancels it.
Base Case
A range of $11.534 to $13.056 could hold most of the month, per the October 2026 analysis.
Bear Case
Trading under $11.534 could expose $10.599 before month-end. And a reclaim of $12.207 would weaken it.
Risks That Could Change the Chainlink Price Prediction
Bitcoin leads the tape. U.S. spot Bitcoin ETFs lost $82.39M on Oct 16, 2026, per SoSoValue. Headlines help sentiment. But headlines don't force buyers.
Final Takeaway
This Chainlink price prediction stays bearish while LINK trades under $12.207 inside the channel. And $11.534 decides whether the dip stays orderly. Levels first. Headlines second.
Disclaimer: This article is for educational market analysis only and isn't financial advice. Crypto assets are highly volatile, and readers should research independently before trading.