CPI Data Today: Will Bitcoin, Ethereum, XRP Rally or Crash on Oct 14?


Crypto prices are quiet today. Traders are waiting for the CPI data release at 8:30 AM ET.
The total crypto market cap sits near $2.8 trillion. Bitcoin, Ethereum, and XRP are moving in tight ranges as the market holds its breath.
Here is what ETF flows, sentiment, liquidations, and charts show before the number lands.
What Is the CPI Data Forecast for Today?
The US September report is the main event of the day. Headline inflation is forecast to speed up on both a monthly and yearly basis.
Measure | Forecast | Previous |
Headline CPI (month on month) | 0.6% | 0.4% |
Headline CPI (year on year) | 3.6% | 3.4% |
Core CPI (month on month) | 0.2% | 0.3% |
Core CPI (year on year) | 2.5% | 2.4% |
A hotter print could back the "higher for longer" rate story. That tends to help the US Dollar and hurt rate-sensitive assets.
A softer number could pull yields lower. That may weaken the Dollar and bring buyers back to Gold and higher-beta coins.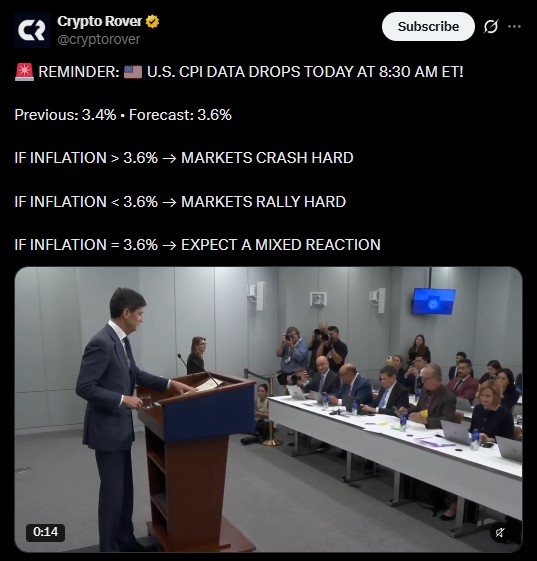
Why Are Bitcoin, Ethereum and XRP Prices Flat Today?
Mostly because nobody wants to bet big before the CPI data. Liquidity can be thin, and conviction is low.
Still, money has been flowing in. According to SoSoValue, US spot Bitcoin ETFs saw $176 million in net inflows on October 13. Fidelity's FBTC led with $103 million.
Spot Ethereum ETFs added $24.84 million. Grayscale's Ethereum Mini Trust (ETH) led with $16.73 million. The XRP ETF was flat.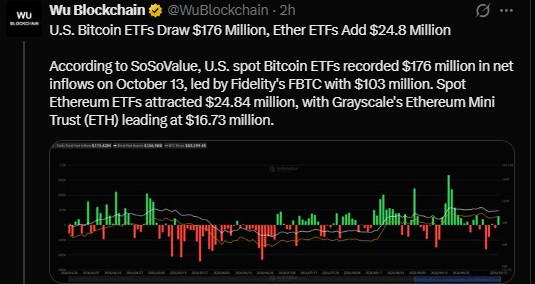
Sentiment is also improving. The Crypto Fear and Greed Index reads 62, which is Greed.
Period | Index Reading | Label |
Now | 62 | Greed |
Yesterday | 57 | Greed |
Last week | 71 | Greed |
Last month | 57 | Greed |
The reading is better than yesterday and last month. It is still below last week's 71.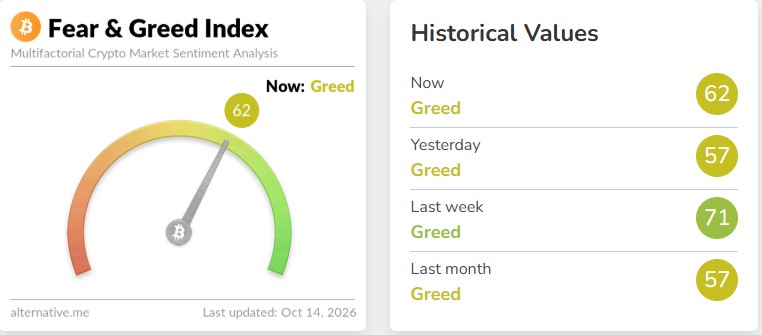
How Much Crypto Was Liquidated in the Last 24 Hours?
CoinGlass shows $140 million in total liquidations. A total of 60,290 traders were hit.
Liquidation Data (24h) | Value |
Total liquidations | $140.00M |
Long liquidations | $81.16M (58%) |
Short liquidations | $58.84M (42%) |
Ethereum (ETH) | $20.59M |
Bitcoin (BTC) | $20.11M |
Largest exchange share | Binance, 53.3% |
Largest single order | $1.11M short, BTCUSDT on Binance at $83,980.28 |
Last 1 hour | $7.99M (shorts $7.40M) |
Last 4 hours | $23.16M (longs $13.29M, shorts $9.87M) |
Last 12 hours | $49.66M (longs $22.71M, shorts $26.95M) |
ETH saw slightly more liquidations than BTC. ETH was split almost evenly, with 50.8% longs. About 58.3% of the BTC total came from shorts.
Altcoins took hits too. SNDK saw $7.52M, ZEC $6.67M, and SOL $6.30M. Other coins together hit $22.65M, and 74.4% of that was longs.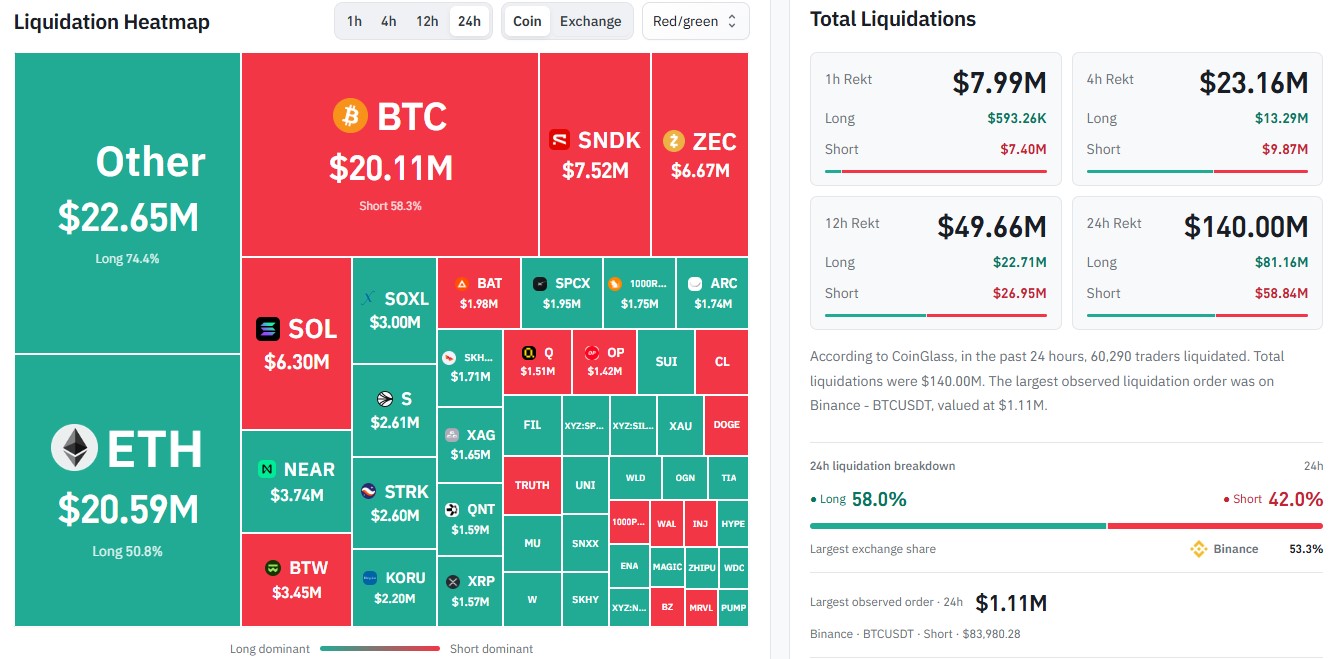
Bitcoin Price Prediction Today: Can BTC Break $84,000?
Bitcoin moved above $84,000 but could not hold it. That level also matches the 50-day SMA.
Analyst Ali Martinez pointed to a setup that looks like an earlier bounce. Back then, BTC held the 200-day SMA and closed above the 50-day SMA. A rally followed.
He sees $84,000 as the level to watch. A 4-hour close above it could confirm a move toward $93,000.
Nothing is confirmed until that close happens. A failed breakout could also send price back down.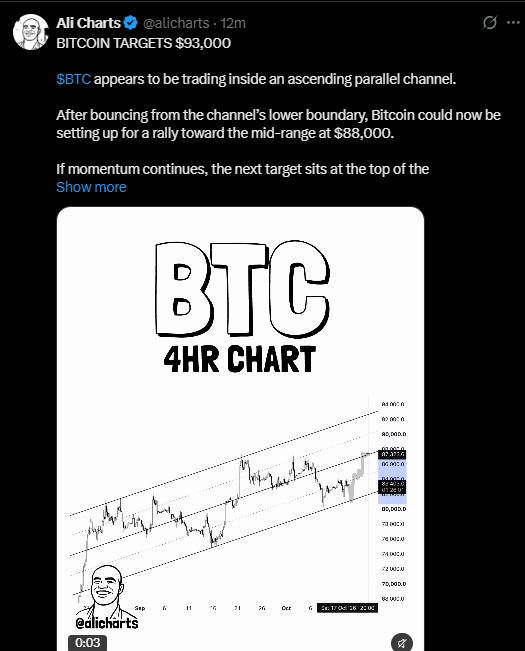
Ethereum Price Prediction: Will ETH Hold $2,500 and Reach $2,800?
ETH was rejected near $2,750 to $2,800 and then fell back to $2,500. On the daily chart, it trades inside a wide rising channel and sits near the lower line.
Price is below the 20-day EMA at $2,570, which points to weak short-term momentum. It still holds above the 50-day EMA near $2,501. RSI is near 43.67, soft but not oversold.
Level | Type | Note |
$2,750 to $2,800 | Resistance | Recent rejection zone |
$2,570 to $2,600 | Resistance | 20-day EMA area |
$2,450 to $2,500 | Support | 50-day EMA near $2,501 |
$2,355 | Support | 100-day EMA |
$2,310 | Support | 200-day EMA |
If ETH holds $2,450 to $2,500, a retest of $2,600 is possible. After that, $2,700 to $2,800 comes into view.
A clear break below $2,450 could open the way toward $2,350 to $2,300.
XRP Price Prediction: Will XRP Go Up or Down From $1.37?
XRP moves inside a descending channel after being rejected near $1.60 to $1.66. It is down about 9% this week.
Price is below the 20-day EMA (1.4251)andthe50-dayEMA(1.3947). The 200-day EMA at $1.3794 acts as a cap. The 100-day EMA at $1.3403 is holding as support.
RSI is near 42. That is weak but not oversold.
Level | Type | Note |
$1.60 to $1.66 | Resistance | Recent rejection zone |
$1.48 to $1.50 | Resistance | Possible target if $1.43 breaks |
$1.40 to $1.43 | Resistance | 20-day and 50-day EMAs |
$1.33 to $1.30 | Support | Near 100-day EMA |
$1.25 to $1.20 | Support | Deeper downside area |
A short spike does not erase the weekly drop. Bulls need a close above the EMAs to change the picture.
How Could Higher or Lower Inflation Move Crypto Prices?
The last reading was 3.4%. The forecast is 3.6%.
One popular crypto account says a reading above 3.6% could crash markets, while a lower one could spark a rally. A match may bring a mixed reaction. That is one view on social media, not a sure outcome.
Prices held firm into the release. Moves can be sharp when the CPI data lands, so levels may change fast.
Watch BTC at $84,000, ETH at $2,450, and XRP at $1.33. Those are the lines traders are using today.
Disclaimer
This article is for information only and is not financial, investment, or trading advice. Crypto assets are volatile, and you can lose some or all of your money. Prices and forecasts can change fast. Do your own research and speak with a licensed financial advisor before you make any decision.

















