XRP Price Drops to $1.36: Why Is XRP Down Today Before the CPI Data?

XRP is trading near $1.36 today, down 2.91% in the last 24 hours. Traders are now watching the U.S. CPI report on October 14, the main event this week.
This XRP price prediction looks at the chart, derivatives data, and ETF numbers. For now, the short-term view is bearish to neutral.
What Is the XRP Price Today?
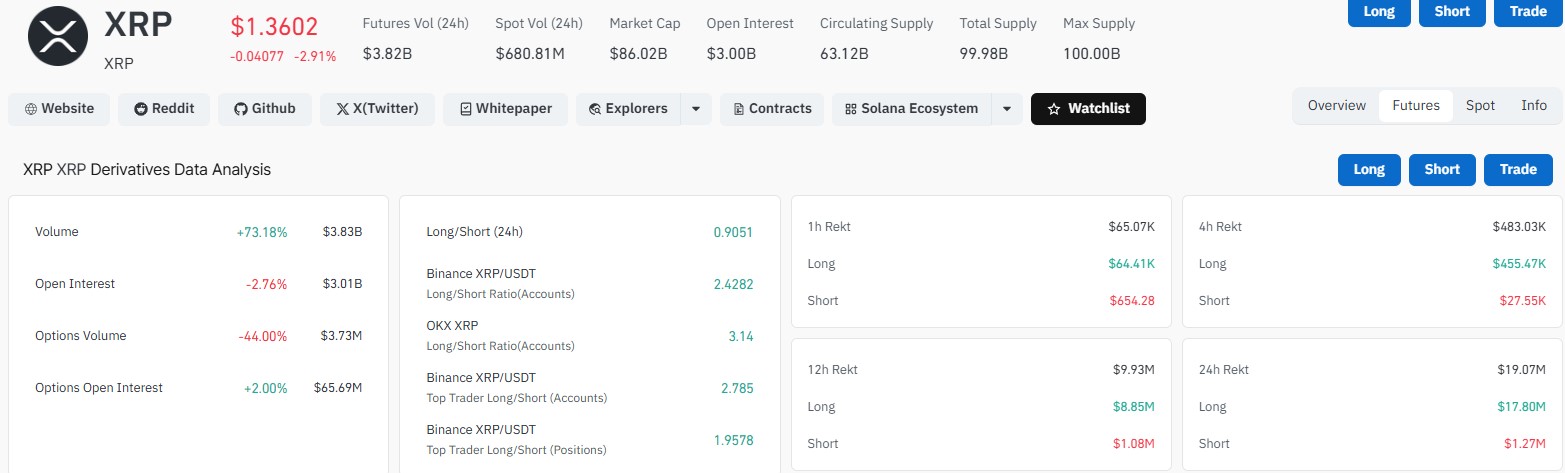
XRP price today is $1.3602, down $0.04077 on the day, based on CoinGlass data.
Futures volume jumped 73.18%, but open interest fell 2.76%. More trading, fewer new bets. That often means traders are closing positions, not opening fresh ones.
Metric | Value |
Price | $1.3602 |
24h change | -2.91% |
Market cap | $86.02 billion |
Futures volume (24h) | $3.82 billion |
Spot volume (24h) | $680.81 million |
Open interest | $3.00 billion |
Circulating supply | 63.12 billion |
Max supply | 100 billion |
XRP News Today: Why Is XRP Down Ahead of the CPI Report?
The big macro event is the U.S. CPI report on October 14. Inflation data can change rate hopes, and crypto often reacts fast.
Many traders may sit back until the number is out. That can mean quiet moves before the report and sharp ones after.
XRP Latest News: What Are Standard Chartered, OKX and RLUSD Doing?
Santiment says the RLUSD institutional story is picking up. Standard Chartered has launched custody for XRPL, and Ripple joined an investment in OKX at a $25 billion valuation.
Those are real steps for the ecosystem. Still, Santiment's chart shows price drifting lower over many months. So far, good XRP news has not turned into a strong rally.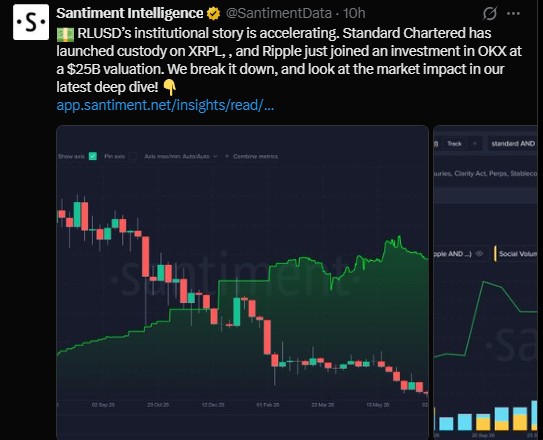
XRP Price Forecast: Are Traders Bullish or Bearish?
The 24-hour long/short ratio is 0.9051. Anything below 1 means slightly more shorts than longs.
But the bigger accounts look different. Several ratios sit well above 1, so traders are not all on the same side.
Long/Short Ratio | Reading |
Overall (24h) | 0.9051 |
Binance XRP/USDT (accounts) | 2.4282 |
OKX XRP (accounts) | 3.14 |
Binance top traders (accounts) | 2.785 |
Binance top traders (positions) | 1.9578 |
How Much XRP Was Liquidated in the Last 24 Hours?
Longs took most of the pain. Out of $19.07 million wiped out in 24 hours, $17.80 million came from long positions.
Period | Total | Longs | Shorts |
1 hour | $65.07K | $64.41K | $654.28 |
4 hours | $483.03K | $455.47K | $27.55K |
12 hours | $9.93M | $8.85M | $1.08M |
24 hours | $19.07M | $17.80M | $1.27M |
Options are quiet. Volume fell 44% to $3.73 million, while options open interest rose 2% to $65.69 million.
Are XRP ETFs Seeing Inflows Right Now?
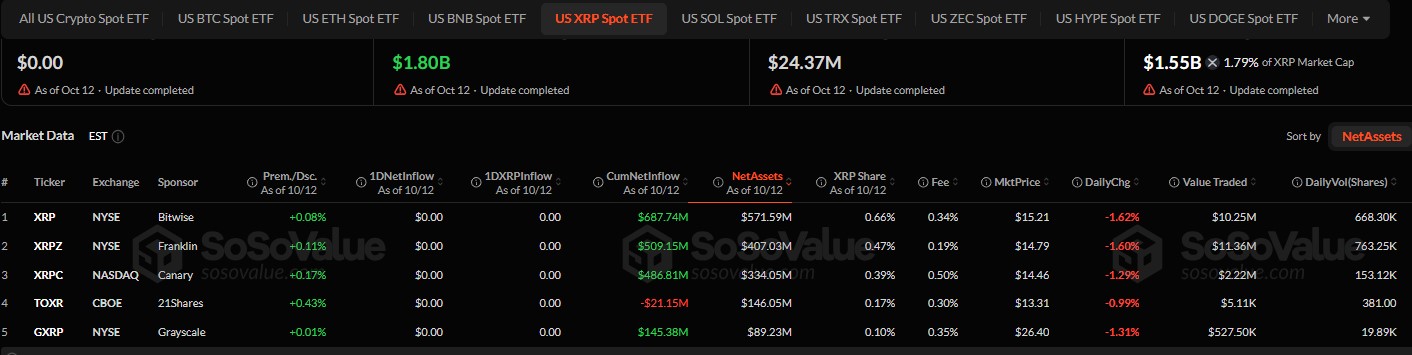
Not right now. As of October 12, daily net inflow was $0 across all five U.S. spot XRP ETFs. Daily value traded was $24.37 million.
Total net assets are $1.55 billion, about 1.79% of XRP market cap. Cumulative net inflow stands at $1.80 billion.
Ticker | Sponsor | Net Assets | Cumulative Inflow | Daily Change |
XRP | Bitwise | $571.59M | $687.74M | -1.62% |
XRPZ | Franklin | $407.03M | $509.15M | -1.60% |
XRPC | Canary | $334.05M | $486.81M | -1.29% |
TOXR | 21Shares | $146.05M | -$21.15M | -0.99% |
GXRP | Grayscale | $89.23M | $145.38M | -1.31% |
XRP Price Prediction: What Are the Key Support and Resistance Levels?
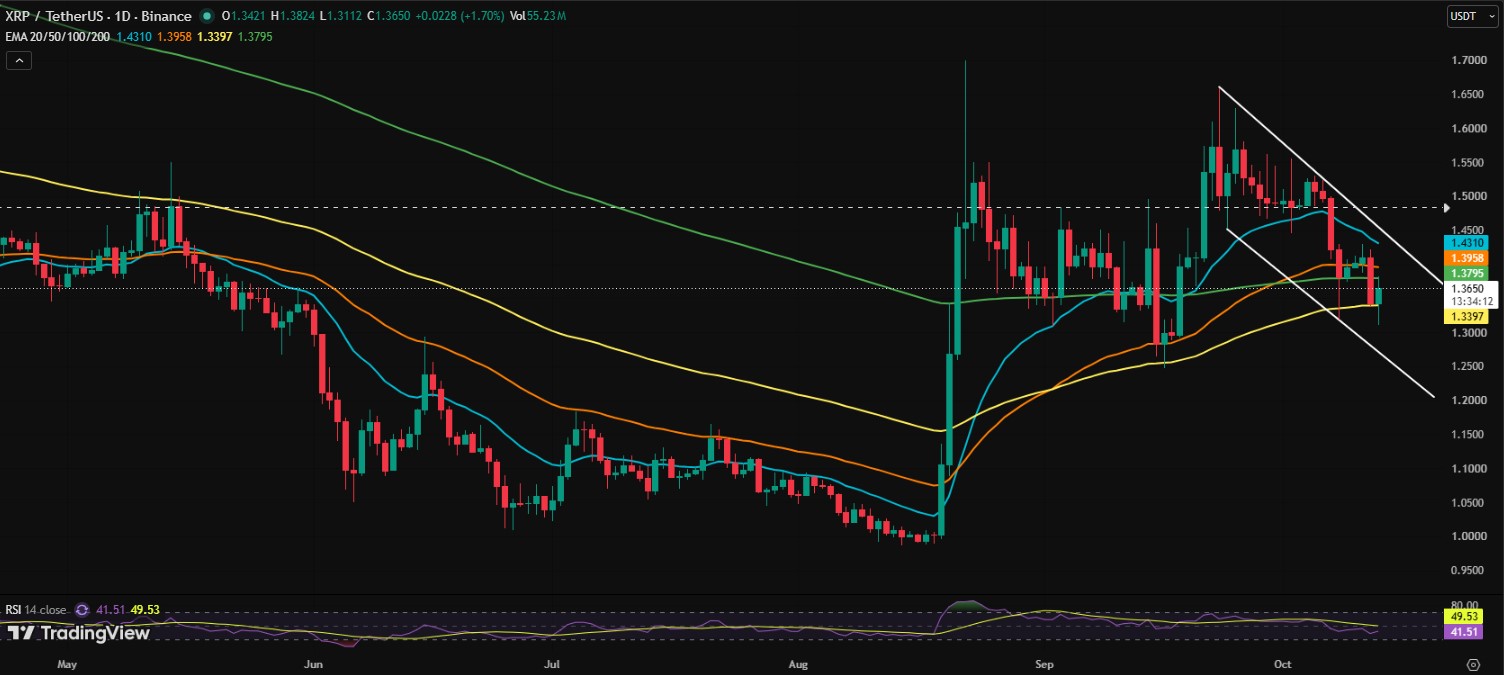
On the daily chart, XRP is moving inside a descending channel. It was rejected near $1.60 to $1.66 earlier.
Price sits below the 20-day EMA at $1.431 and the 50-day EMA at $1.396. It is also under the 200-day EMA at $1.3795.
The 100-day EMA at $1.3397 is holding as support so far. RSI is near 41.5, which shows weak momentum but not oversold conditions.
Level | Type | Note |
$1.60 to $1.66 | Resistance | Recent rejection zone |
$1.48 to $1.50 | Resistance | Possible target if $1.43 breaks |
$1.40 to $1.43 | Resistance | 20- and 50-day EMAs |
$1.33 to $1.30 | Support | Near 100-day EMA |
$1.25 to $1.20 | Support | Deeper downside area |
Will XRP Go Up or Down After the CPI Report?
If XRP fails to reclaim $1.40 to $1.43, a slide toward $1.33 to $1.30 is possible. A clean break below that could expose $1.25 to $1.20.
If buyers defend $1.33 to $1.30 and push above $1.43, a move toward $1.48 to $1.50 could follow.
Nothing here is certain. A hot or cool CPI print could change the picture quickly. The outlook stays bearish to neutral until XRP breaks the descending trendline and wins back the key moving averages.
Disclaimer
This article is for information only and is not financial, investment or trading advice. Crypto prices are volatile, and you can lose some or all of your money. Price levels and views here are not guarantees. Do your own research and speak with a licensed financial advisor before making any decision.

















