Crypto Market Manipulation? BTC, XRP, ADA Surge as Shorts Get Wiped


Is crypto market manipulation behind the latest bounce? Bitcoin, XRP, and Cardano all rose from key support zones after sudden jumps in on-chain activity.
Derivatives traders also took heavy losses in the same window. Here is what the numbers show.
Is the Crypto Market Being Manipulated Right Now?
Nobody can prove that from this data. Still, the pattern is hard to ignore.
Analyst Ali Charts, using Santiment data, showed all three coins near support. Each saw a sharp spike in activity. Price bounced soon after.
Coin | Support Zone | Activity Spike | Price Move |
Bitcoin (BTC) | Around $81,200 | Exchange inflows: 7,682 to 25,124 BTC | Up to a high of $83,407 |
XRP | Around $1.25 | XRPL volume: 215.87 million to 49.17 billion | About 5.10%, to $1.32 |
Cardano (ADA) | Around $0.21 | Whale transactions over $1 million: 24 to 51 | About 5.51%, toward $0.23 |
The question is whether large players are driving these quick rebounds. The data shows timing, not intent.
How Much Money Did Crypto Traders Lose in 24 Hours?
CoinGlass data shows 72,818 traders were liquidated. Total losses reached $286.37 million.
Shorts took most of the pain. They lost $209.30 million, or 73.1%. Longs lost $77.07 million, or 26.9%. That points to a sharp move up that caught bearish traders off guard.
The pace also picked up through the day. Liquidations rose from $5.31 million in one hour to $28.95 million over four hours.
Time Frame | Total Liquidations | Longs | Shorts |
1 hour | $5.31M | $2.65M | $2.67M |
4 hours | $28.95M | $6.34M | $22.62M |
12 hours | $53.95M | $17.23M | $36.71M |
24 hours | $286.37M | $77.07M | $209.30M |
The largest single order was a $11.96 million BTCUSDT position on Binance.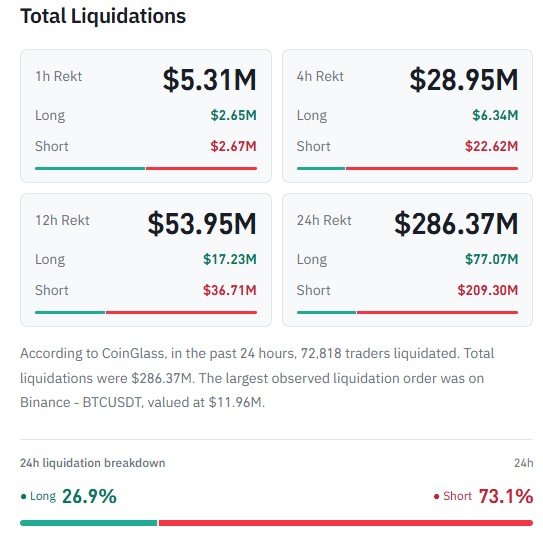
Why Did Bitcoin Jump to $83,407?
Bitcoin rose from about $81,200 to a high of $83,407 yesterday. Exchange inflows surged at the same time, from roughly 7,682 BTC to 25,124 BTC.
Higher inflows can mean coins are headed to be sold. They can also mean traders are repositioning. The data does not say which.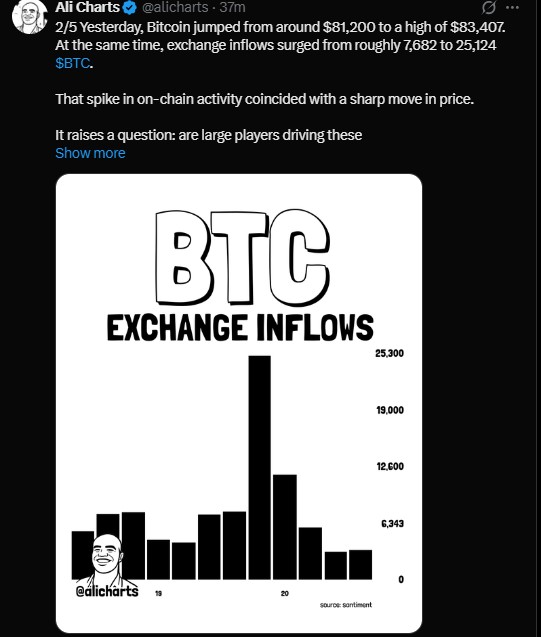
There was news from Switzerland too. FINMA approved the country's first retail spot Bitcoin ETF, with strict custody and risk rules. It gives everyday investors a regulated way in.
Why Did XRP Bounce From the $1.25 Support Level?
XRP traded near $1.25 when XRP Ledger transaction volume leaped from about 215.87 million to 49.17 billion.
The coin then climbed about 5.10%, to around $1.32.
XRP's MVRV ratio sits near 0.92. That means holders are at a small net loss. Historically, this zone has carried lower risk than times when holders sit on big profits.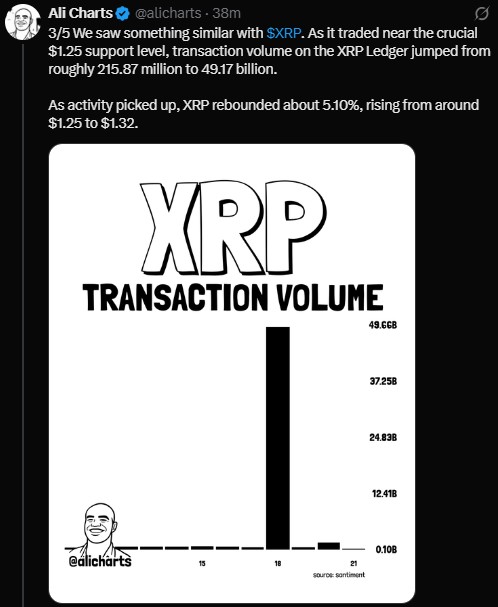
Is Cardano About to Drop to $0.17?
Cardano showed a similar setup near $0.21. Whale transactions above $1 million rose from about 24 to 51. ADA then moved up about 5.51%, toward $0.23.
The biggest whales are quiet, though. Wallets holding 100 million to 1 billion ADA have stayed mostly flat for 10 days. Their past changes often matched major price moves, but there is no clear direction now.
The chart carries a warning. Cardano's SuperTrend indicator has turned bearish. The last similar signal came on May 22 and was followed by a 46% correction.
A daily close below $0.21, the lower edge of its rising channel, would signal a breakdown and open the way to $0.17. History does not always repeat, but the signal is worth watching.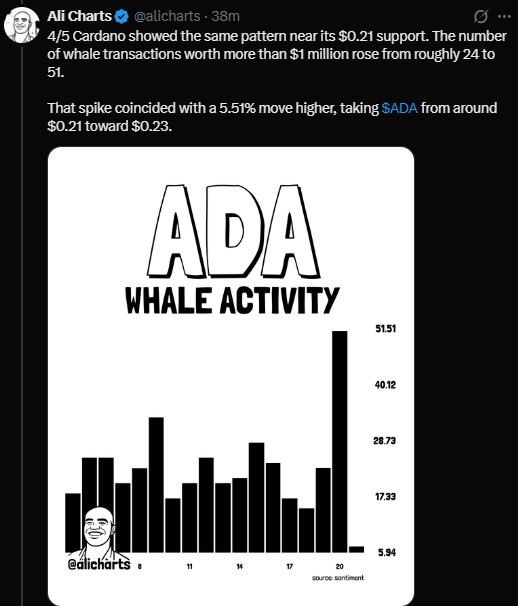
What Should Crypto Traders Watch Next?
The sell signal on Cardano is here, but the breakdown is not. Ali Charts is watching whether $0.21 holds and whether whales start cutting their positions.
Crypto market manipulation is hard to prove from public charts. The data does show large spikes in activity near support, quick bounces, and a wave of short liquidations. Some of that activity is visible on-chain.
Key levels for now: $81,200 for Bitcoin, $1.25 for XRP, and $0.21 for Cardano.
Disclaimer
This article is for information only and is not financial advice. Crypto assets are volatile, and you can lose money. Past performance does not guarantee future results. Do your own research and speak with a licensed financial advisor before investing.







