Dash Price Prediction: Will AIBC Nomination Push DASH Past $55?


Can a coin that just jumped 8.1% in a day keep climbing, or is this another quick pop before a dip? That's the question hanging over Dash right now, and the earlier Dash $100 outlook already showed how tricky these levels get.
This Dash price prediction breaks down the charts, futures data, and exchange activity as of October 23, 2026, 04:30 UTC. DASH price sits near $55 after a breakout, and a fresh AIBC Awards nomination for Best Layer 1 Blockchain may be adding fuel.
Dash Price Today: 24-Hour Market Data
DASH price today sits at $55.00 as of 04:30 UTC on October 23, 2026, up 8.1% in 24 hours, per CoinGecko data.
| Metric | Value |
| Price | $55.00 |
| 24h change | +8.1% |
| Market cap rank | 91 |
| Market cap | $708.169M |
| 24h trading volume | $103.483M |
| Circulating supply | 12.876M DASH |
| Max supply | 18.92M DASH |
Dash Coin News: AIBC Awards Nomination
Source: news from Dashpay
Dash just landed a nomination. Best Layer 1 Blockchain, AIBC Awards 2026, Rome. Voting ends October 26 UTC, per the official Dash announcement
The post went up about eight hours before this snapshot, so the nomination is likely one reason for the jump. More attention can lift buyer interest for a day or two, and more interest can help price.
But it isn't the only reason, since the channel breakout and forced buying from shorts did much of the work. Real progress still matters more over time.
Dash Open Interest Trend: Traders Are Coming Back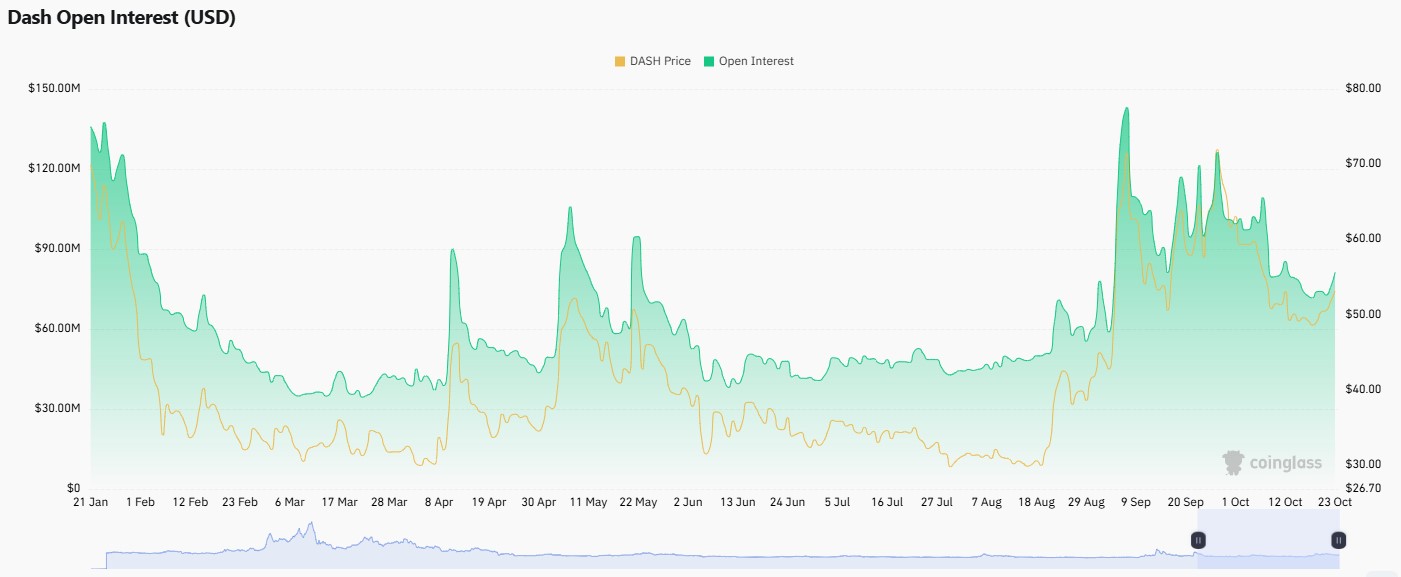
Source: Data Taken From CoinGlass
Dash open interest is the total value of futures contracts still open, meaning bets nobody has settled yet.
It started near $135M around January 21, with a price near $70. Both slid after that, with open interest falling to about $35M by March and the price near $30.
A jump to roughly $143M came around September 9 with a price near $70. But by mid-October, it had dropped to about $72M. Now comes a slow climb back toward $80M as the price recovers.
Dash Liquidation Data: Short Trade Took the Heavier Hit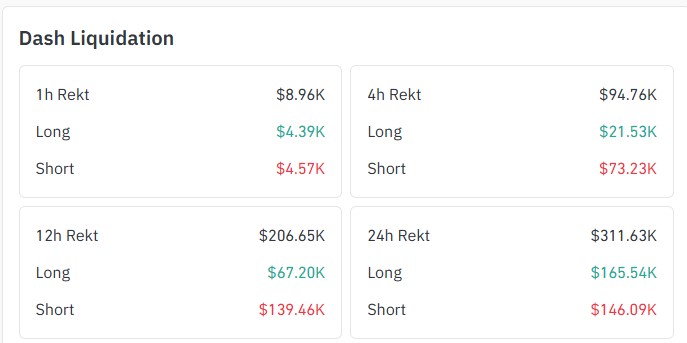
A $DASH liquidation happens when an exchange forces a trader who borrowed money out of a trade because the cash backing it runs low.
Coinglass liquidation data shows $311.63K wiped out in 24 hours, with $165.54K from longs and $146.09K from shorts.
Mostly shorts sellers lost $139.46K over 12 hours and $73.23K in the last four, against just $21.53K for longs. And that forced buying fed the breakout.
Dash Trading Volume Across Exchanges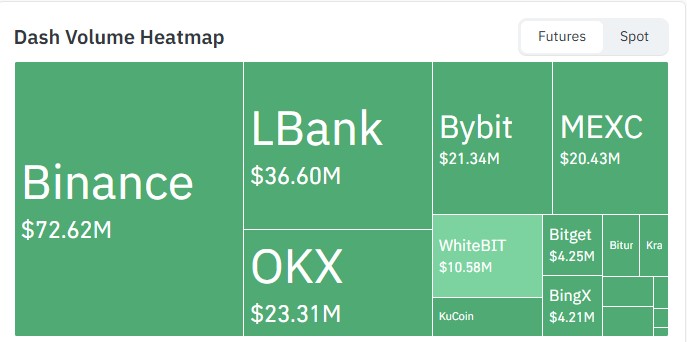
Source: Data Taken From CoinGlass
Dash trading volume reached $103.483M in 24 hours, about 14.6% of market cap. Binance leads the futures heatmap at $72.62M, then LBank at $36.60M and OKX at $23.31M. Trackers count exchanges differently.
Perps open interest on CoinGecko is $251.225M, about 35.5% of market cap. That heavy futures trading is common across the wider altcoin market, though it makes price swings sharper both ways.
Dash 4-Hour Technical Analysis and Chart Breakout Explained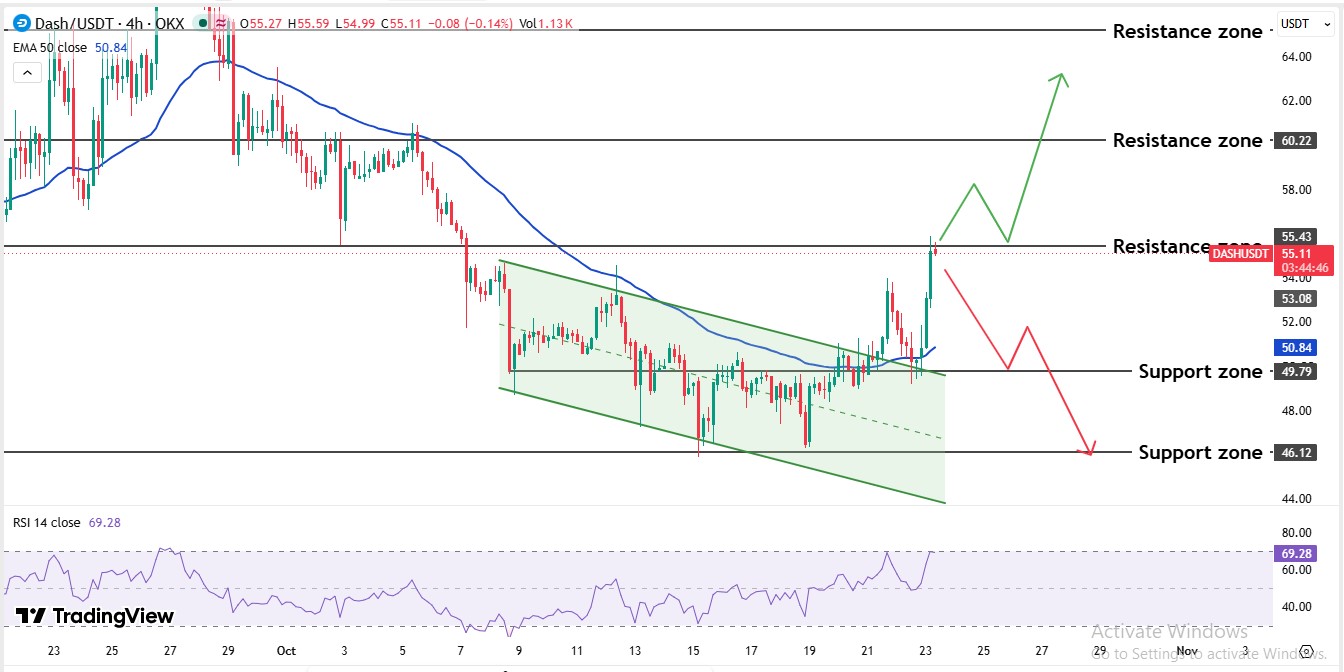
From about October 8, the price slid inside a falling channel. Dash technical analysis starts there, since lower highs and lower lows mean sellers were in charge.
Buyers defended $46.12 support twice, around October 15 and October 19. Then, right at the top of the channel. That's where the price broke out around October 20 and jumped above the 50-period EMA at $50.84; that tracks the recent average price.
The price came back to test $49.79 and held. Then it ran up to $53.08 and hit a high of $55.59.
RSI reads 69.28, just under 70, since 70 usually means buyers are running hot. Then again, strong trends can stay hot for days, and price sits well above the 50-period EMA at $50.84. And that gap acts like a safety net.
Dash Price Outlook: Support and Resistance Levels
Five Dash support and resistance levels matter most. Resistance (a ceiling where sellers tend to show up) sits at $55.43, then $60.22, then roughly $65. Support (a floor where buyers tend to step in) waits at $49.79 and $46.12.
Price is pressing right against $55.43 now, and any Dash price prediction depends on that level. Is it a speed bump or a wall? Earlier Dash price targets explored where $60 and $100 fit.
| Level | Type |
| $65 | Resistance |
| $60.22 | Resistance |
| $55.43 | Resistance |
| $49.79 | Support |
| $46.12 | Support |
Dash Price Prediction: Bull, Base, and Bear Cases
Three cases frame this Dash price prediction. In the bull case, buyers push through $55.43 and hold it when the price comes back to test it, which points toward $60.22, then roughly $63 to $65.
The base case is a pause. Price could move sideways between $49.79 and $55.43 while the 69.28 RSI cools off. And the bear case starts with a failed push at $55.43, which opens a dip to $49.79, then $46.12 if that floor breaks.
| Case | Trigger | Invalidation |
| Bull | Breakout and hold above $55.43 | Trades back below $49.79 |
| Base | Price stalls near $55.43 as RSI cools | Price leaves the range |
| Bear | Failed push at $55.43, then a break below $49.79 | Price gets back above $55.43 and stays |
The short-term Dash price outlook leans bullish, since the breakout is fresh, though 69.28 on RSI says to be normal.
Any Dash price forecast needs fresh data daily, so rising volume and open interest matter.
Dash Price Prediction: Expert Outlook
As per Coingabbar analysis, the short-term setup is seen as bullish while $49.79 holds. Price broke out of a falling channel, shorts had to buy back, and open interest is climbing back, a healthy mix for a push toward $60.22.
But $55.43 is the test. A firm hold above it keeps buyers in charge, while a failed push brings $49.79 into view. Swings can turn fast, so patience beats chasing the move.
Disclaimer: This article is for information only and isn't financial advice. Crypto prices move up and down fast, so doing proper research matters before any trade.

















