Dessa Price Prediction: Can a 4-Day-Old Memecoin Hold $0.00975?


Can a memecoin that's only four days old really keep its rally alive?
That's the question hanging over this Solana memecoin after 13,000 wallets piled in almost overnight. The Dessa price prediction below weighs the hourly chart against the holder list.
Fresh tokens tend to follow a script of loud hype first and quiet doubt later, a pattern that shows up often in the latest memecoin news.
Dessa Price Prediction: Why Is the Token Surging Today?
The token is up roughly 76% in 24 hours on GeckoTerminal. Volume hit $3.4M. Net buying stood at $48.88K.
A first volume burst hit around 16:00 UTC on Oct 29, another followed on Oct 31 and pushed the pool high to $0.02138.
Attention drove it. Real news would land first on the official X account.
$DESSA Market Data Snapshot
The Dessa price today sits at $0.01577, up 73.6% on CoinGecko market data at around 10:30 UTC on Oct 31.
Metric | Value |
Price | $0.01577 |
24h range | $0.008035 to $0.0204 |
Market cap | $15.39M |
24h volume | $3.84M |
Pool liquidity | $358.6K |
Circulating supply | 979.13M |
Holders | 13,009 |
Market cap is $15.39M. But pool liquidity is only $358.6K, about 2.3% of that value, so thin pools can swing price fast in both directions.
Circulating supply matches total supply at 979.13M, so no locked batch is waiting to hit the market.
$DESSA Technical Analysis: What the Hourly Chart Shows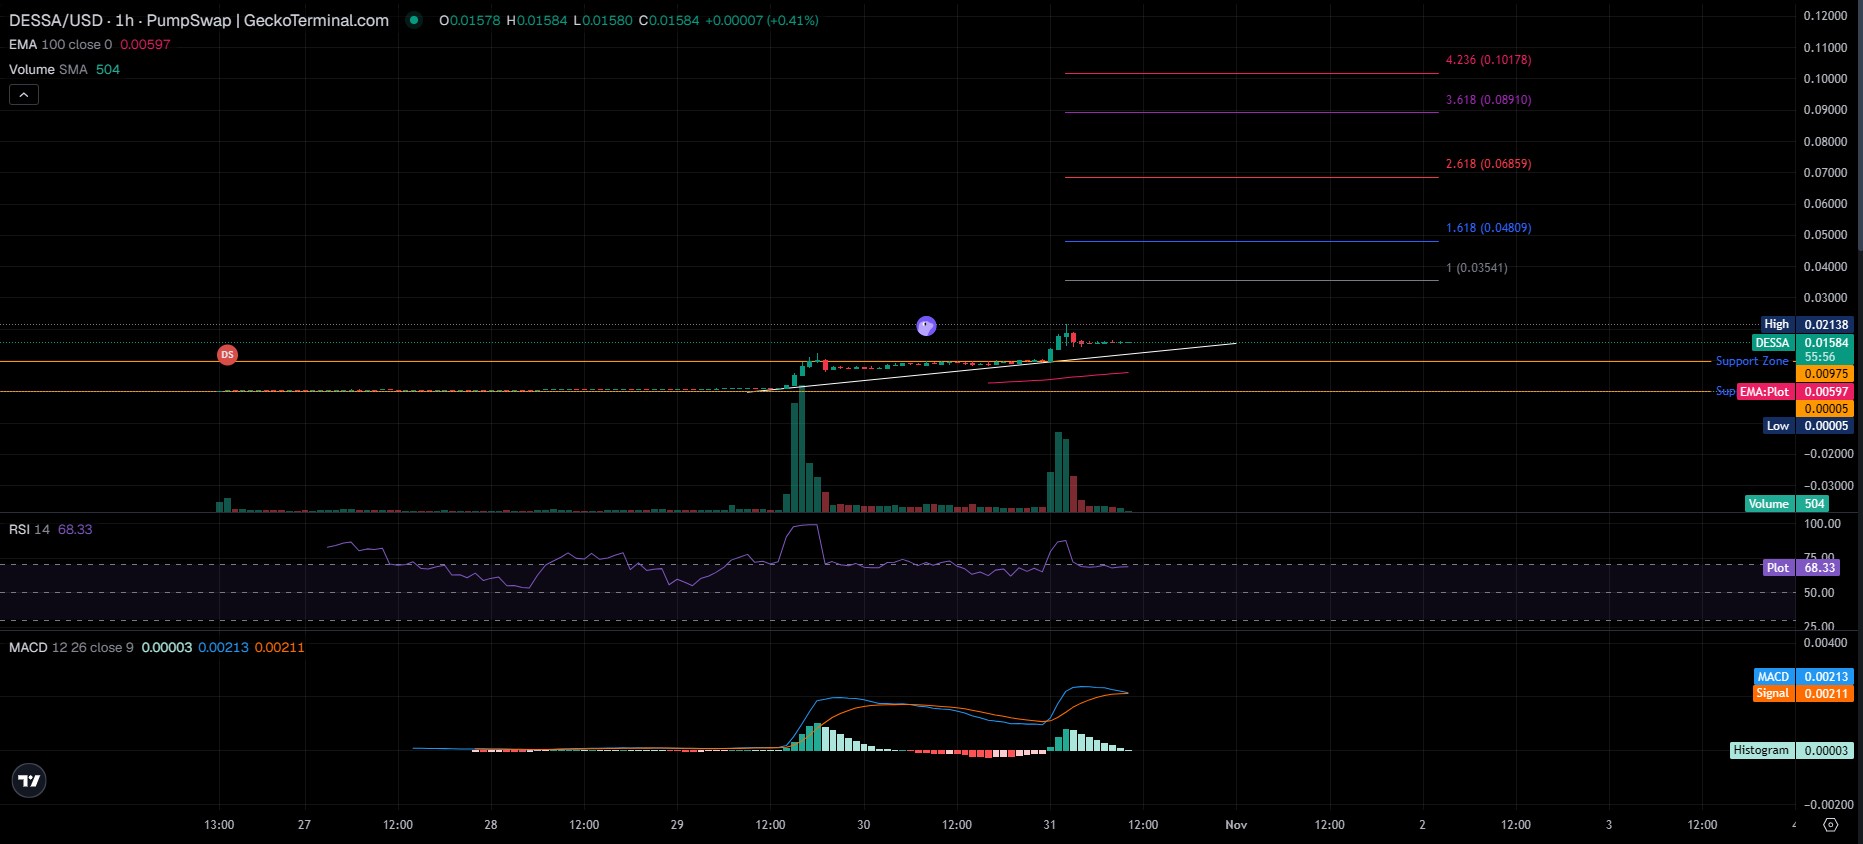
On PumpSwap, the price trades near $0.01577, according to the GeckoTerminal pool chart. Buyers then pushed it to $0.00975 on Oct 29 around 16:00 UTC, and it based there for a day and a half.
The burst on Oct 31 did the rest, and the price settled near $0.0158.
RSI, a 0 to 100 gauge of buying heat, reads 68.33, just under the 70 level where traders call a coin overbought. MACD, which compares a fast and a slow moving average to show momentum, sits at 0.00213 against a signal line of 0.00211. That gap is razor thin.
Flat candles after the spike seem like exhaustion. Scratch that. Price held above its rising trendline while volume cooled, and that's a pause, not a reversal.
The 100 EMA, an average that weights recent prices more, sits at $0.00597, far below price. A Fibonacci extension, a set of levels that project targets from an earlier swing, stacks $0.03541, $0.04809, $0.06859, $0.08910, and $0.10178 overhead.
Key Support Levels
The first Dessa support level is $0.00975, the base that launched the Oct 31 move. If sellers push the price under it. Then the 100 EMA at $0.00597 becomes the next floor.
Key Resistance Levels
Resistance starts at $0.02138, the pool high on Oct 31. CoinGecko's tracker lists $0.0204 as the all-time high. And a clean hold above both opens the path toward $0.03541.
Holder Data: Who Controls the Supply?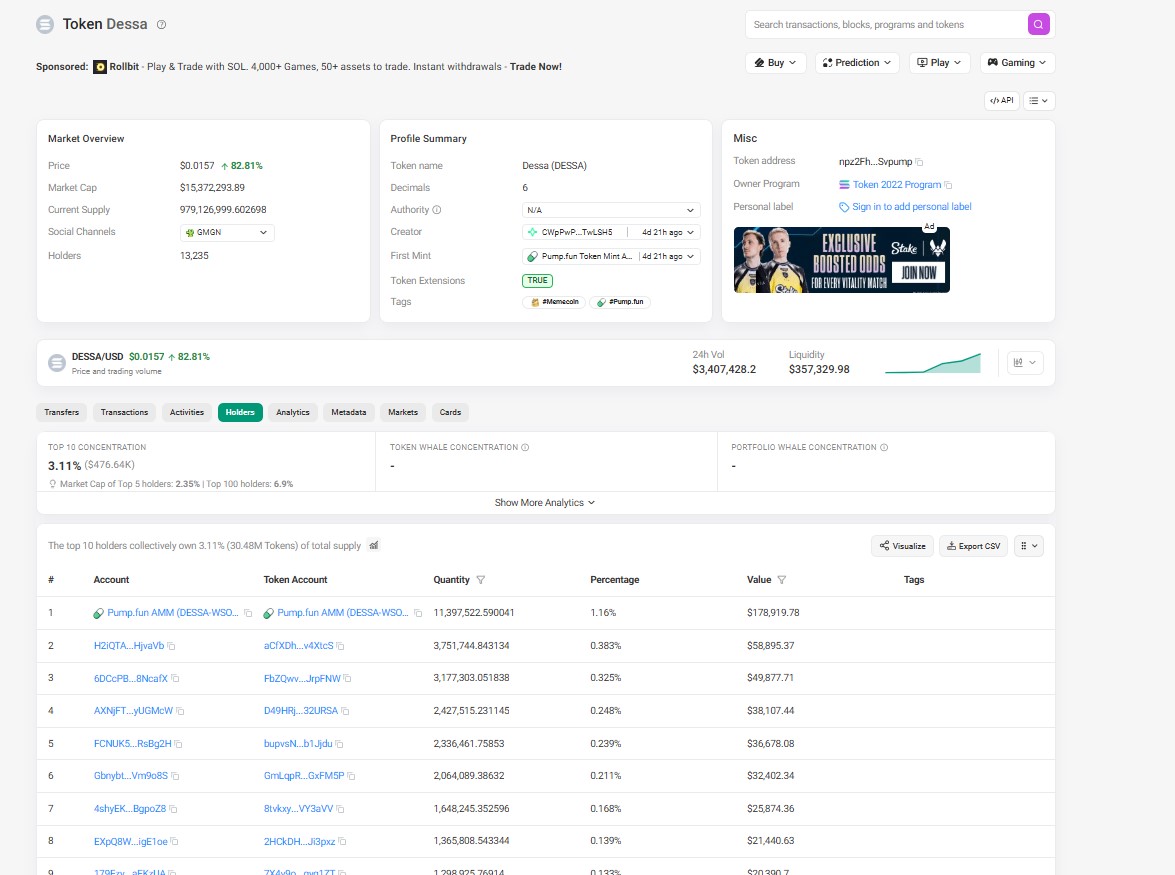
Holders jumped from roughly 3.6K to 13K in a week, and the top 10 wallets own only 3.11% of supply, or 30.48M tokens worth $476.64K on the Solscan holder list.
The biggest holder is the Pump.fun AMM pool at 1.16%. That stake is liquidity, not a seller waiting.
Several of the next largest wallets sit on unrealized gains from 38% to 257% without a single sale. And that's the risk.
So what happens when any of them decides that 257% is enough?
Dessa Price Prediction: Bull, Base, and Bear Paths
Targets in this Dessa price prediction come from chart levels, and no target comes with a guarantee. Readers who want more setups can browse other crypto price predictions.
Scenario | Trigger | Target | Invalidation | Liquidity Condition |
Bull | Hourly hold above $0.02138 | $0.03541, then $0.04809 | Breaks below the rising trendline | Pool depth grows past $358.6K as buys outweigh sells |
Base | Range trading between $0.00975 and $0.02138 | Chops around $0.0158 | Trades under $0.00975 | Pool stays near $358.6K as volume fades |
Bear | Hourly breakdown under $0.00975 | $0.00597 at the 100 EMA | Reclaims $0.00975 | Pool drains as holders sell into it |
The lean is bullish while the hourly chart holds above $0.00975. And a break under it flips the stance to bearish, with $0.00597 as the target.
What Could Change the Outlook
Thin pool depth is the first risk. A $358.6K pool behind a $15.4M valuation can reprice hard on a single large sell order.
But momentum is cooling already. Price gained 9.79% over the past 6 hours and only 0.41% in the last hour.
Because buyers outnumber sellers by only 702 trades, with 9,643 buys against 8,941 sells in 24 hours. A wave of selling flips that edge quickly.
Memecoins this size often chase bigger venues, and exchange listing updates are where that news would surface first.
Long-Term Outlook Beyond the Pump
Extension targets stretch far above the current price. A move to $0.03541 would put market cap near $34.7M, and $0.10178 would mean about $99.7M, a 6.4x gain from here.
That takes deeper pools and steady buyers. When attention fades. Price tends to follow.
And narratives rotate fast. Traders tracking AI crypto news see money hop between AI tokens and memecoins quickly, which can leave a fading story behind.
Disclaimer: This article is for information only and isn't financial advice. Crypto prices swing hard, new memecoins can fall to zero, and readers should research independently and risk only what they can afford to lose.