Crude Oil Price Prediction: Is a Big WTI Move Coming After Ras Tanura?


The latest crude oil price prediction is rising after a report said Saudi Aramco shut a major unit at its Ras Tanura refinery.
Traders want to know whether supply worries can lift oil from here. WTI last closed near $102.94 per barrel, and the market is shut for the weekend.
WTI, short for West Texas Intermediate, is the main US oil benchmark. It is a light, low-sulfur crude delivered at Cushing, Oklahoma.
According to TradingView, WTI crude oil price today is $102.94 per barrel, up $0.09 at the close of 02:29 on October 31, 2026 (UTC+5:30).
Live WTI Crude Oil Data
Metric | Value |
Instrument | CFD on WTI Crude Oil (USOIL) |
Price | $102.94 per barrel |
Change | +$0.09 (+0.09%) |
Quote Time | At close, 02:29, October 31, 2026 (UTC+5:30) |
Source: TradingView, TVC feed, as of October 31, 2026.
Crude Oil News Today
Crude oil news today centers on Saudi Arabia. A post on X, citing Bloomberg, says Saudi Aramco shut a major processing unit at its Ras Tanura refinery after Houthi attacks three days ago.
The refinery handles 550,000 barrels per day, and the damaged unit could stay offline for at least a month.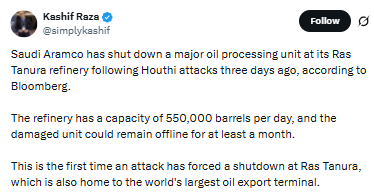
Source: Data Taken From the @simplykashif X Account
The post also says this is the first time an attack has forced a shutdown at Ras Tanura.
That part looks doubtful, since The National reported in March 2026 that Aramco shut the refinery after a drone attack.
Baird Maritime reported on October 27 that the Houthis claimed a missile strike on the refinery.
Saudi authorities did not confirm the strike, though Bloomberg, citing a source, said a fire near the terminal was contained.
A search found no separate confirmation of the unit shutdown or the one-month estimate.
Crude Oil Technical Analysis
This crude oil price prediction October 31 reads the daily WTI chart from TradingView.
Price moves inside a symmetrical triangle that formed after the spike in March and April.
The upper trendline slopes down from those highs, and the lower one slopes up through the lows of June, August, and October.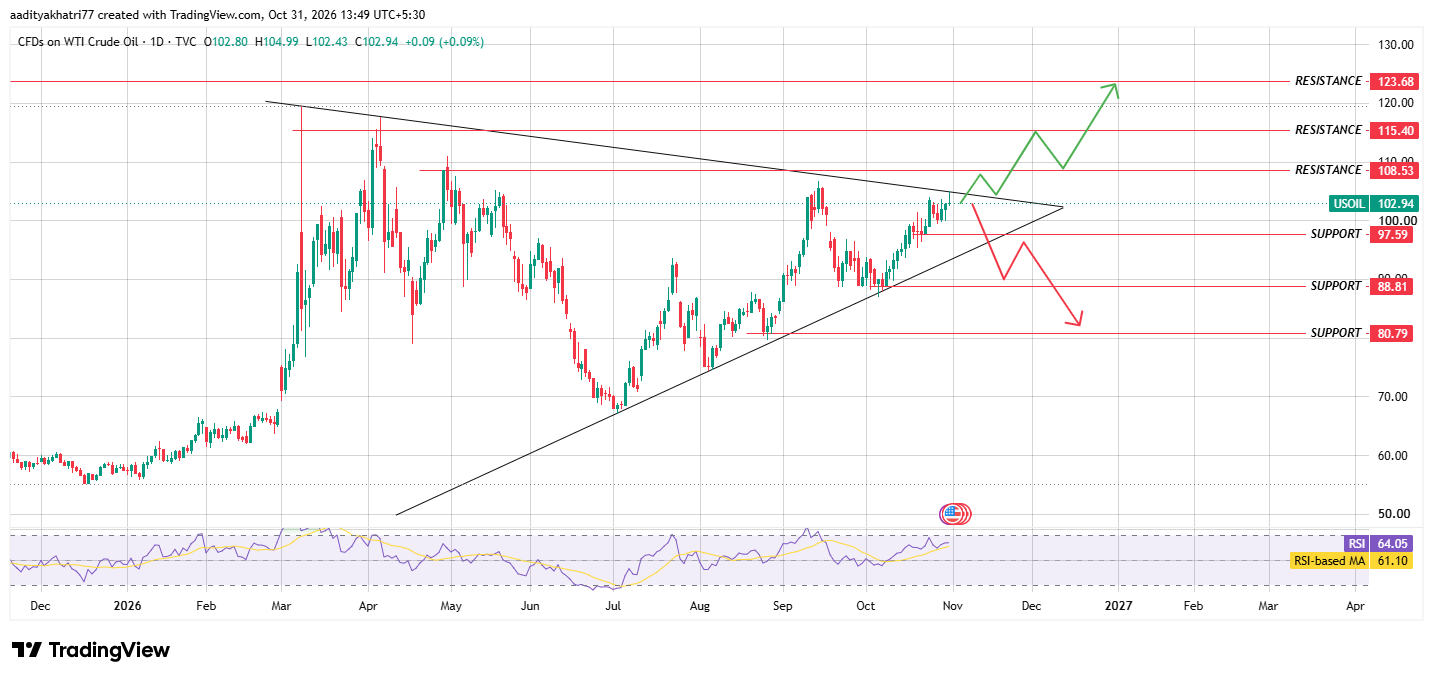
Source: TradingView, USOIL 1D, TVC, as of October 31, 2026.
Both lines meet near $102 around December. The falling trendline now runs near $105, and the rising one near $94.
The latest daily candle reached $104.99, just under the falling trendline, and then closed lower.
That candle opened at $102.80, ranged from $102.43 to $104.99, and closed near $102.94, a gain of 0.09%.
The RSI reads 64.05 against its average of 61.10, which shows firm momentum below the 70 overbought line.
Can Crude Oil Break the Falling Trendline?
The bullish case starts with a daily close above the falling trendline, near $105, with WTI futures volume over the 20-day average.
The price was turned back there on the latest candle, so a close on thin volume would carry little weight.
After a confirmed break, $108.53 is the first resistance. A close above it would open $115.40 and then $123.68.
The $115.40 level sits near the April highs, so sellers may appear there.
The market is closed for the weekend, so the first candle after it can open with a gap. Traders should wait for a daily close and not trade the opening move alone.
What Happens If Crude Oil Loses Support?
The bearish case begins with a rejection at the falling trendline. In that case, the price would likely drift back toward $97.59, the first support.
A daily close below $97.59 with selling volume above the 20-day average would put the rising trendline in play, near $94.
A close below both would open $88.81 and then $80.79. The first of those matches the October low.
A brief wick under the rising trendline is not enough. If the price closes back above it within a few sessions, the move may prove a false break.
Price Levels to Watch
Support | Resistance |
$97.59 | $108.53 |
$88.81 | $115.40 |
$80.79 | $123.68 |
Bull, Base, and Bear Scenarios for Crude Oil Price Prediction
Scenario | Setup | Level |
Bull | A daily candle finishes above the falling trendline near $105, then above $108.53, with futures volume over the 20-day average. | $115.40 first, then $123.68 |
Base | WTI keeps narrowing inside the triangle, with no daily close beyond $97.59 or the falling trendline. | Between $97.59 and $105 |
Bear | Buyers fail at the trendline, and a daily candle settles under $97.59 and the rising trendline while selling volume tops the 20-day average. | $88.81 first, then $80.79 |
Methodology
This crude oil price prediction 2026 draws on three inputs. The price quote comes from the TVC feed on TradingView for the WTI CFD and shows the close at 02:29 on October 31, 2026 (UTC+5:30).
The chart is a daily USOIL view from the same feed. The news item comes from one post on X that cites Bloomberg.
Support and resistance levels were read directly from the chart. The triangle lines carry no labels, so the $105 and $94 readings are approximate.
A CFD tracks futures prices but is not identical to them, so volume readings should come from WTI futures.
The unit shutdown was not independently confirmed. Brent prices, inventory data, and positioning data were not part of this review, and the scenarios carry no assigned probabilities.
Expert Opinion
According to OilPrice, Houthi attacks have been a major driver of oil prices over the past two months. As general market commentary, a refinery unit outage mainly cuts fuel output.
Its effect on crude depends on how much crude Saudi Arabia exports instead.
The post gave no detail on how much of the 550,000 barrels per day the damaged unit handles.
In the short term, the falling trendline near $105 and the volume on any move toward it will show how the market reads the news.
Disclaimer: This article is for information only and is not financial advice. Oil is volatile, and the price can fall below $80.79 if support fails. and broader market conditions weaken. Weekend news can cause opening gaps. Leveraged products such as CFDs can magnify losses. No scenario here carries a stated probability, and a confirmed breakout can still reverse. Readers should do their own research and size any position to a loss they can accept.