EMBER Price Prediction 2026-2030: Can the Rally Continue?


EMBER just ripped over 100% in a single session, and traders everywhere are asking the same question: how far can this Solana token actually go? This EMBER price prediction breaks down the live price action, RSI and MACD signals, key support and resistance zones, and year-by-year targets through 2030. We also cover the LBank listing, the accelerated token burn, and whale concentration risks most articles skip entirely. Bull, base, and bear scenarios included, with real numbers, not just hype.
EMBER Price Prediction 2026-2030: Can the Rally Continue?
EMBER price prediction is the token for embercurve, built on Solana. It's had a wild few days, jumping over 100% in a single session.
LBank added an EMBER/USDT spot market, then a perpetual contract, on September 11, 2026. That's a big reason volume exploded.
CoinGecko, GeckoTerminal, and Solscan aren't agreeing on the exact EMBER price right now. Verify the contract address before trading. See the full price prediction hub for more scenarios like this.
EMBER Price Today and Market Snapshot
Snapshot taken around 06:00 UTC on September 12, 2026. Prices move fast, so treat this as a reference point.
Metric | Value (UTC snapshot) |
Price | $0.0223 (CoinGecko), $0.0230 (GeckoTerminal) |
24H Change | +147.4% (CoinGecko) / +188.4% (Solscan) |
Market Cap | ~$20.6M to $22.2M |
24H Volume | $86.3M to $100.8M |
Circulating Supply | 996,836,000 EMBER |
Blockchain | Solana |
Holders | 16,464 and rising |
All-Time High | $0.04385, Sep 11, 2026 |
All-Time Low | $0.005661, Sep 11, 2026 |
Volume running four times higher than market cap isn't normal. Full live figures sit on the EMBER CoinGecko page.
Why EMBER Price Is Moving
Recent Price Momentum
Buying pushed EMBER from under $0.01 to over $0.023 in hours, then it cooled and started chopping sideways, as the EMBER live chart shows.
That kind of move rarely holds straight.
LBank Spot and Perpetual Listing
LBank confirmed spot trading, and then a perpetual contract went live on September 11. Track fresh pairs on the exchange listing tracker.
Liquidity and Whale Concentration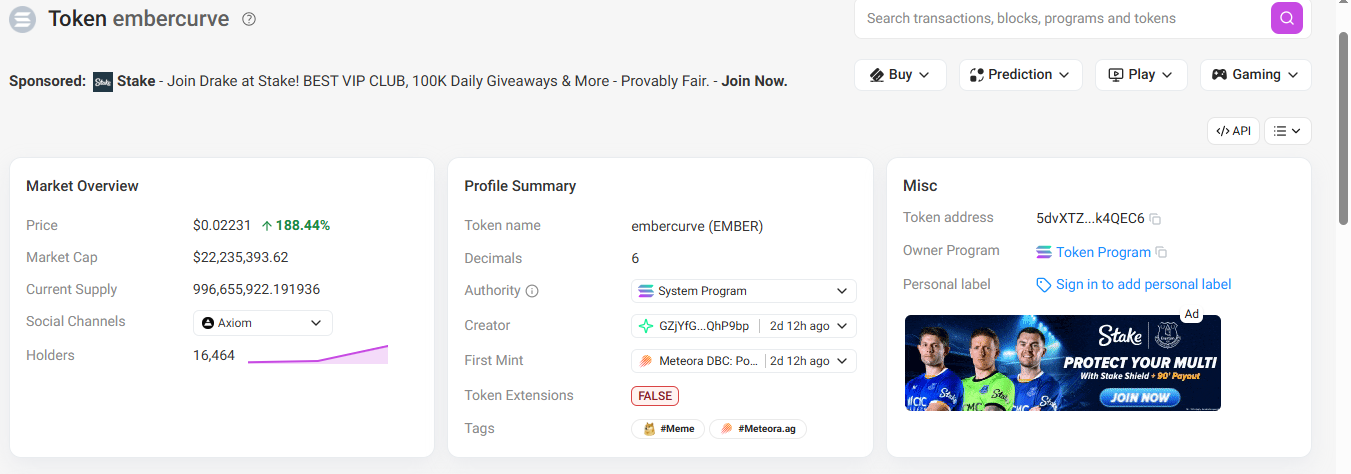
Turns out, the volume isn't as clean as it looks. The top 10 wallets hold 21.63% of supply, worth about $4.1M, and the top 100 holders control 61.01%, according to EMBER holder data. That's concentration risk sitting under a rally this size.
The Burn Event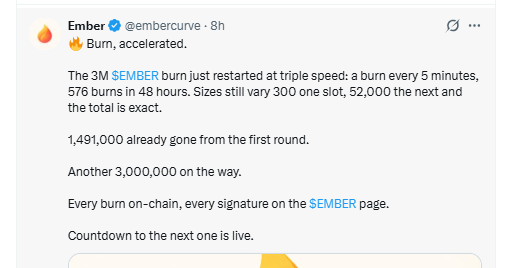
Breaking: Ember's account confirmed a 3,000,000-token burn restarted at triple speed, one burn every five minutes.
1,491,000 tokens are already gone. Every burn is on-chain. See the official press release for the full schedule.
EMBER Technical Analysis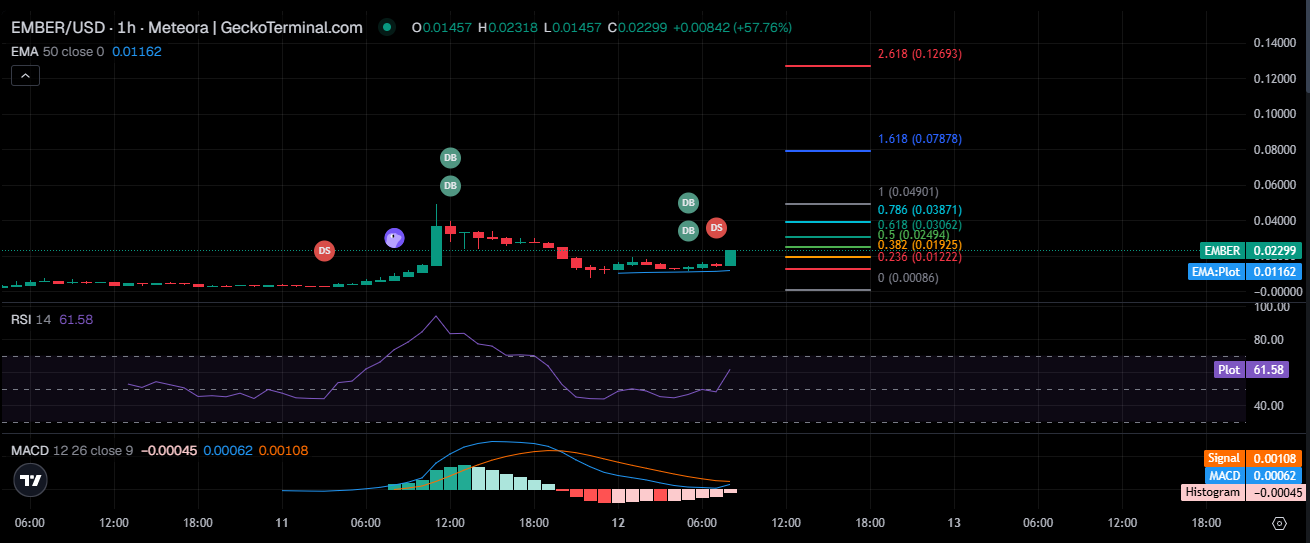
EMBER Trend
Still bullish on the higher timeframe, but tired on the 1-hour trading chart. Price sits well above the 50-period EMA near $0.0116, stretched.
But stretched isn't broken.
EMBER RSI
The 14-period RSI reads 61.58. Healthy, not overheated. Above 70 would worry us.
EMBER MACD
Here's where it gets messier. The MACD line sits below the signal line, and the histogram just turned negative, a bearish crossover on the short-term trading chart.
Right when the crowd is celebrating. Call it a caution flag, not a crash signal.
EMBER Support Levels
The nearest support sits near $0.0193. Below that, $0.0122, then $0.0086.
EMBER Resistance Levels
The first resistance is $0.0249. Above it, $0.0306, then $0.0387, then the all-time high near $0.0439.
Breakout and Breakdown Levels
A trading close above $0.0439 on rising volume opens the door toward $0.049. A trading close below $0.0193 on heavy sell volume opens the door toward $0.0122.
Which one happens first probably decides the next two weeks.
EMBER Price Prediction for the Next 24 Hours
Expected range: $0.019 to $0.028. Bullish trigger: a push through $0.0249 on strong volume. Bearish trigger: a drop under $0.0193 that doesn't recover.
EMBER Price Prediction for the Next 7 Days
Base range: $0.016 to $0.033. Bull needs sustained volume above $50M daily. Bear is a slide toward $0.010 if listing volume fades. Track catalysts on the crypto events calendar.
EMBER Price Prediction 2026
Scenario | Target | Probability | Requirement |
Bear | $0.008 | 25% | Support at $0.0122 fails |
Base | $0.020 - $0.030 | 45% | Price consolidates, volume normalizes |
Bull | $0.045 - $0.060 | 30% | Breaks all-time high with real volume |
EMBER Price Prediction 2027-2030
Fake precision doesn't help here. Annual ranges make more sense, especially with new presale and IDO projects reshaping capital flows each cycle.
Year | Bear Range | Bull Range |
2027 | $0.010 | $0.070 |
2028 | $0.015 | $0.090 |
2029 | $0.020 | $0.110 |
2030 | $0.025 | $0.130 |
EMBER Price Prediction 2027: Bear $0.010, Bull $0.070
This is the year right after launch hype settles. The bear case ($0.010) assumes the listing and burn excitement fades, volume drops back to normal levels, and EMBER trades near its early post-launch floor. The bull case ($0.070) assumes it breaks well past its current all-time high of $0.0439, roughly 1.6x that high, if Solana activity and exchange liquidity keep growing through the year.
EMBER Price Prediction 2028: Bear $0.015, Bull $0.090
The bear floor rises slightly from 2027. That's the idea that even in a weak scenario, a token with an established holder base and ongoing burns tends to find a higher floor than it did in year one. The bull case ($0.090) pushes further, assuming continued supply reduction from burns plus wider crypto market growth.
EMBER Price Prediction 2029: Bear $0.020, Bull $0.110
Same logic, one step up. The bear range assumes EMBER has matured into a smaller-cap but stable token. The bull range assumes multiple growth cycles have compounded, so each successive bull scenario builds on the last one instead of starting from scratch.
EMBER Price Prediction 2030: Bear $0.025, Bull $0.130
The furthest-out year carries the widest uncertainty, so both ends stretch higher. The bear case ($0.025) is still above 2026's likely trading range, assuming the project survives and keeps some real usage. The bull case ($0.130) is the most speculative number in the table, it would require EMBER's market cap to grow roughly 6x from today's level, which needs sustained demand, not just short-term listing buzz.
Can EMBER Reach $0.05 or $0.10?
At $0.05, implied market cap sits near $49.8M, about two-and-a-half times today's level. Needs fresh volume, not leftover listing excitement.
At $0.10, implied market cap climbs to roughly $99.7M, nearly five times current levels. Some holders chase extra upside through crypto airdrops too.
EMBER Bull Case, Base Case, and Bear Case
Bull Case
Liquidity keeps expanding, volume stays elevated, and higher highs form as the burn shrinks supply.
Base Case
Momentum cools, price consolidates, and liquidity normalizes.
Bear Case
The rally reverses, liquidity thins, holders sell into strength, and support breaks.
EMBER Risks Traders Should Watch
Extreme volatility
Liquidity risk once listing hype fades
Holder concentration among top wallets
Data discrepancies across trackers
Perpetual futures leverage amplifying moves
Rapid reversal after parabolic runs
Stay ahead of new risks through daily crypto news updates.
What Could Invalidate the EMBER Bullish Setup?
The bullish thesis weakens fast if EMBER loses $0.0193 with rising sell volume and can't reclaim it within a day or two.
Fine. That's the line in the sand. Everything else is noise until that level breaks or holds.
EMBER Price Prediction: Trader Takeaway
Bullish above: $0.0249
Neutral between: $0.0193 - $0.0249
Bearish below: $0.0193
Disclaimer
This article is informational only, not financial advice. EMBER is a highly volatile, low-cap token, and prices differ across exchanges. Verify the contract address, do your own research, and never invest more than you can afford to lose.









.jpg)








