Ethena Price Prediction: Can ENA Hold $0.12748 Support This Week?

Will Ethena bounce from the $0.12748 support level or slide to a lower support level?
This Ethena price prediction begins with ENA trading far under its late-October highs, with sellers still in control. Traders tracking Ethena key levels have seen every rebound fail lower than the last. The next move hangs on one support level and one moving average.
Ethena Price Forecast: 24-Hour Market Snapshot
Per CoinGecko market data, ENA trades at $0.13021 after a 20.9% drop over seven days.
Metric | Value |
Price | $0.13021 |
7-day change | -20.9% |
24h range | $0.1285 to $0.1423 |
Market cap | $1.757B |
Market cap rank | 46th |
FDV | $1.953B |
Total value locked | $4.909B |
Perpetual futures open interest (24h) | $311.823M |
Circulating supply | 13.5B ENA |
Total supply | 15B ENA |
Source: CoinGecko, data captured Nov 14, 2026, 06:04 UTC
Fully diluted valuation is the token's value if every one of its 15B tokens were already circulating.
With 90% of the max supply circulating, future dilution looks limited. But 24h volume equals 20.3% of market cap.
Ethena Whale Wallets: Top 10 Hold 59.16% of Supply
Holder analytics for ENA show a heavily top-weighted supply. The Etherscan token page lists the contract. The top 100 holders control 88.63% of supply.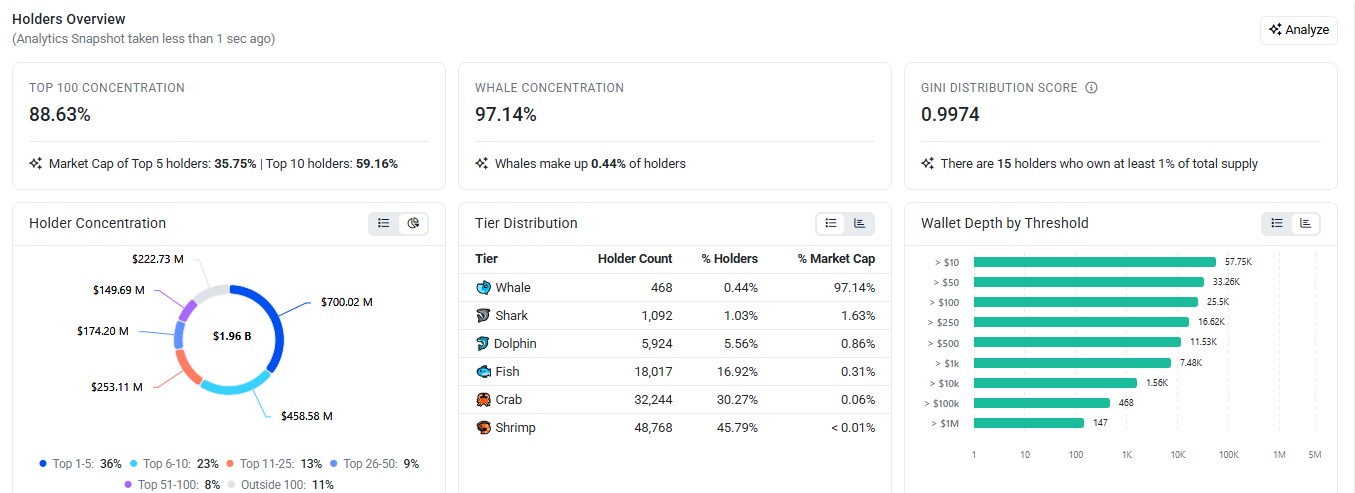
Source: Etherscan, ENA holders overview, captured Nov 14, 2026, 06:04 UTC
The top 5 hold 35.75%, and the top 10 hold 59.16%. Ethena whale wallets, the largest holders by balance, have 468 addresses. They own 97.14% of market cap.
A few large exchange transfers could add sell orders fast.
Ethena Liquidation Data: $2.43M in Longs Wiped Out
Longs took the hit. A liquidation is a forced exit when an exchange shuts a borrowed-money trade after losses eat its margin.
CoinGlass liquidation data shows longs took 93.5% of the 24h total.
Window | Total | Longs | Shorts |
1h | $7.13K | $0.00 | $7.13K |
4h | $1.82M | $1.81M | $8.75K |
12h | $2.03M | $2.01M | $13.39K |
24h | $2.60M | $2.43M | $171.51K |
Source: CoinGlass, ENA liquidations, data captured Nov 14, 2026, 06:04 UTC
Most of the damage landed within 4 hours. The latest hour was quiet. Forced long sellers add supply into a falling market, and a fresh push would need new sellers.
Ethena Open Interest and Volume Data
Open interest is the total value of futures contracts still open and unsettled. Per CoinGlass futures data, ENA open interest totals $336.74M.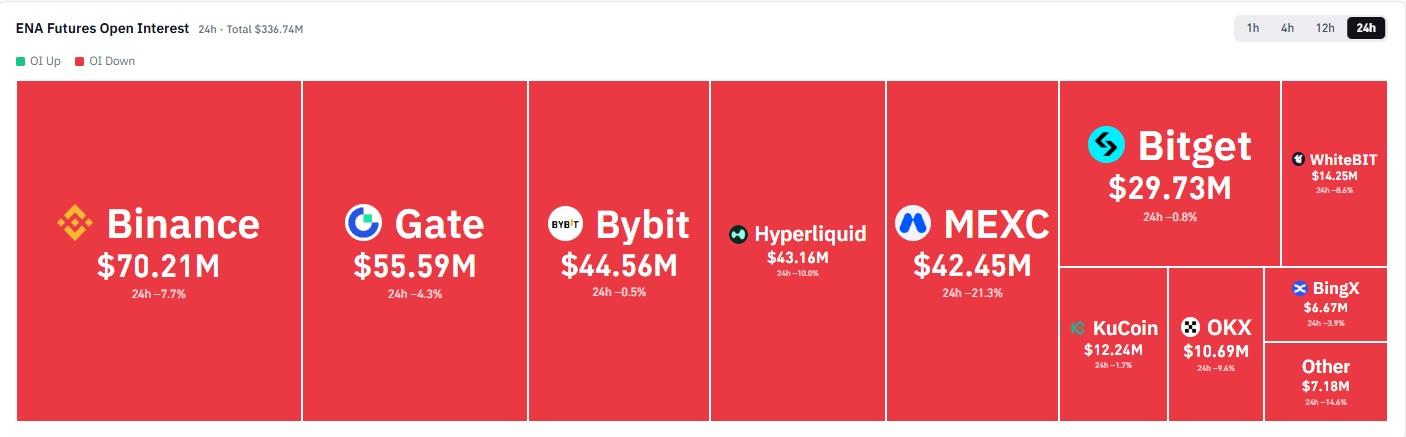
Source: CoinGlass, ENA futures open interest, captured Nov 14, 2026, 06:04 UTC
Binance holds $70.21M of it, and Gate holds $55.59M. Every listed exchange shows a decline.
Falling open interest during a drop means traders are exiting positions, not adding new ones. With it down at every exchange, is that fresh selling
Total futures volume reads $499.70M over 24 hours.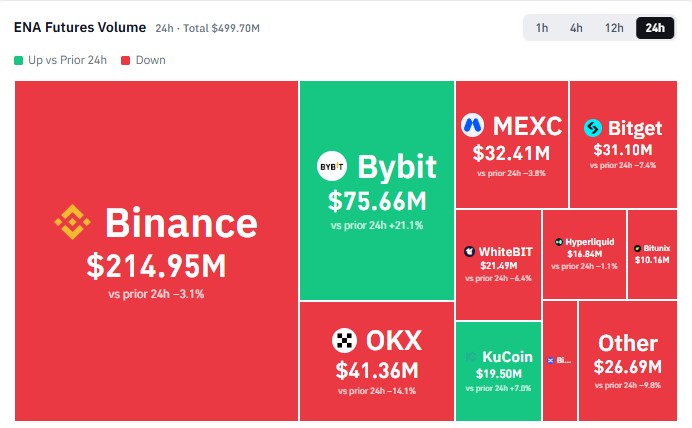
Source: CoinGlass, ENA futures volume, captured Nov 14, 2026, 06:04 UTC
Binance traded $214.95M of that, and Bybit traded $75.66M and up 21.1%.
Ethena Technical Analysis: 50 EMA and RSI Levels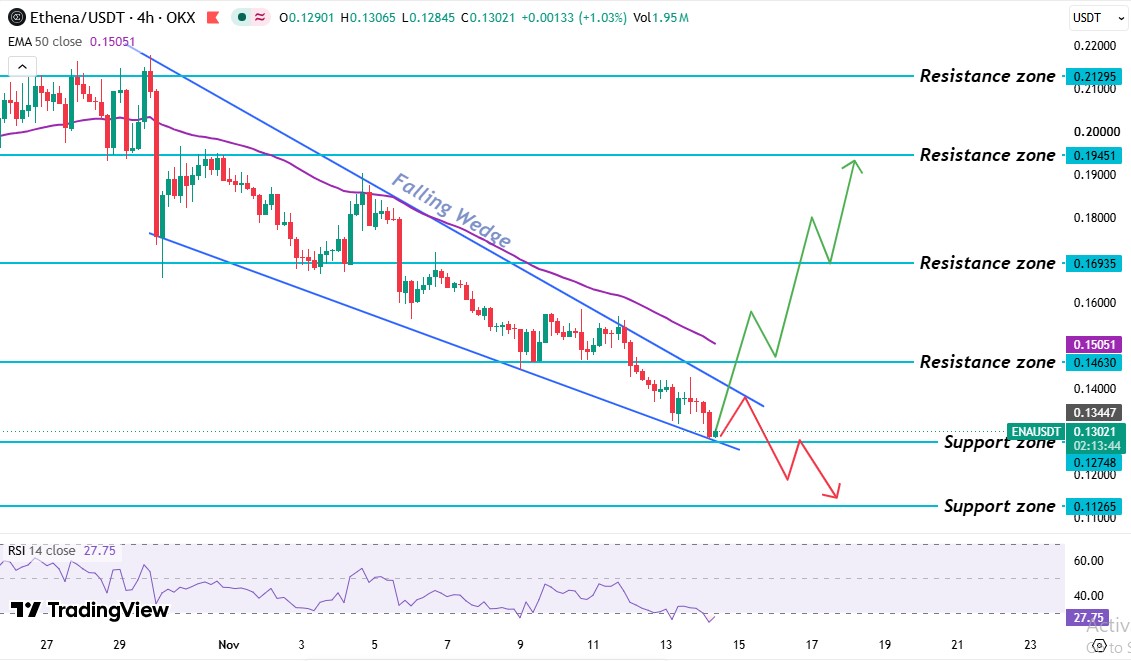
Source: TradingView (OKX), $ENA/USDT 4H chart with EMA 50 and RSI 14, captured Nov 14, 2026, 06:04 UTC
The OKX 4H chart for $ENA/USDT on TradingView frames this Ethena price prediction. A late-October drop pushed ENA away from the $0.21295 resistance level before sellers took control.
ENA first traded sideways under the $0.21295 resistance level, a price where sellers have held. It then broke down through the 50 EMA, an exponential moving average of the last 50 candles.
A bounce toward the $0.19451 resistance level got rejected. Later rebounds stalled at the $0.16935 previous support level, now resistance level and again at the EMA.
Traders mapping the month can pair this chart with the Ethena November forecast, though every rebound here failed at a lower level than the last.
The latest rebound pushed past the $0.14630 resistance level, then failed at the upper trendline of a falling wedge, two down-sloping trendlines that narrow together.
Right now, $ENA hovers just above the $0.12748 support level and well under both the $0.14630 resistance level and the 50 EMA level.
The $ENA 50 EMA sits at $0.15051. ENA's $0.13021 price trades 13.6% below it, and the latest candle trades below the line too. So a real recovery needs candles trading above it and the $0.14630 resistance level.
The ENA RSI reads 27.75 on the 14-period setting. Under 50 means sellers hold the edge. Under 30 means selling has gone too far and a bounce is possible.
ENA Price Outlook: Support and Resistance Levels
Level | Type |
$0.21295 | Resistance level |
$0.19451 | Resistance level |
$0.16935 | Resistance level |
$0.15051 | 50 EMA |
$0.14630 | Resistance level |
$0.12748 | Support level |
$0.11265 | Support level |
The nearest support levels and resistance levels are $0.12748 and $0.14630.
Ethena Price Forecast: Bull, Base, and Bear Scenarios
Scenario | Trigger | Target | Invalidation |
Bull | Daily candle trades above $0.14630 | $0.16935, then $0.19451 | Falls back below $0.14630 |
Base | Price stays between $0.12748 and $0.14630 | Sideways trade inside that range | Daily candle breaks either level. |
Bear | Daily candle trades below $0.12748 | $0.11265 | Daily candle trades above $0.14630 |
This Ethena price prediction carries two risks. A daily candle below $0.12748 would end the wedge bounce case.
Ethena Price Prediction: Expert Outlook
According to CoinGabbar analysis, the bearish side holds the stronger case in this Ethena price prediction. Long liquidations made up 93.5% of the 24h total, and open interest fell on every listed exchange.
The bounce case looks easy to argue on RSI alone. A reading of 27.75 only marks stretched selling, and the EMA still sits 15.7% above.
Traders should track whether the daily candle trades below the $0.12748 level, because a break there means the falling wedge has failed.
Disclaimer: This article is for information only and isn't financial advice. Traders should do their own research and risk only what they can afford to lose.