Ethena Price Prediction November 2026: Can ENA Hit $0.2487?

Is $ENA setting up a real breakout, or just catching its breath before another slide? Price sits near $0.2042 after a 8.1% daily gain.
This Ethena price prediction november 2026 reads the daily chart on Oct 26, 2026 at 08:14 UTC and builds the ENA price forecast for November 2026. The old reclaim $0.50 forecast needs a lot more than a 8.1% bounce.
ENA Price 24-Hour Market Data
Metric | Value |
Price | $0.2042 |
24h change | +8.1% |
Market cap | $2.734B |
24h volume | $412.125M |
Circulating supply | 13.406B ENA |
Rank | 39 |
Source: Data taken from CoinGecko
ENA Holder Concentration on Ethereum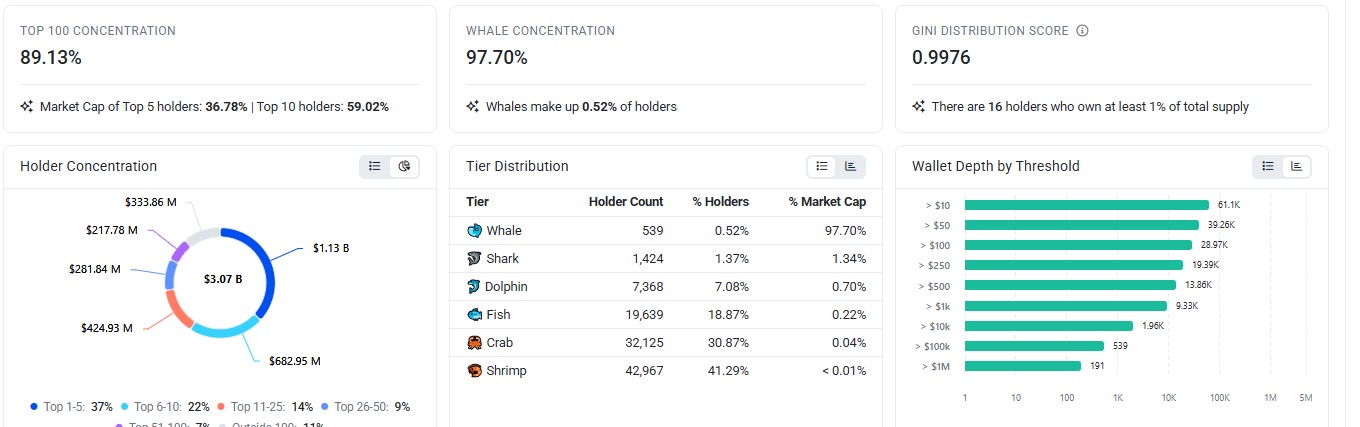
Holder concentration means how much supply a few wallets control. ENA has 104,046 holders, yet the top 5 hold 36.78% of supply, the top 10 hold 59.02%, and the top 100 hold 89.13%. Any Ethena price forecast has to price that in.
The Gini score sits at 0.9976. Sixteen holders each own at least 1% of supply, and balances can be checked on the Etherscan holder list.
ENA Whale Wallets and Exchange Balances
The largest wallet holds 8.2268% of supply, worth $252.56M. The next two hold 8.2126% and 7.8246%, and the sENA token contract holds 6.4321%.
And 539 ENA whale wallets own 97.70% of the market cap, though they're only 0.52% of holders. So who's really steering price here?
ENA Liquidation Data: Shorts Hit First, Then Longs
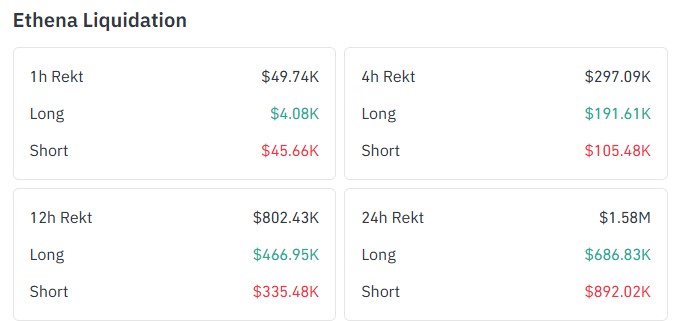
Liquidations hit $ENA again. $ENA liquidation data shows $1.58M gone in 24 hours on Oct 26, 2026. Shorts took the bigger loss at $892.02K, against $686.83K for longs. In the last 12 hours, longs lost $466.95K and shorts lost $335.48K.
Source: Data taken from CoinGlass
Longs got hit again in the last 4 hours, losing $191.61K against $105.48K for shorts. The latest hour turned back, with shorts losing $45.66K and longs only $4.08K. A squeeze above $0.2246 lifts the ENA price target to $0.2487.
ENA Open Interest and Futures Volume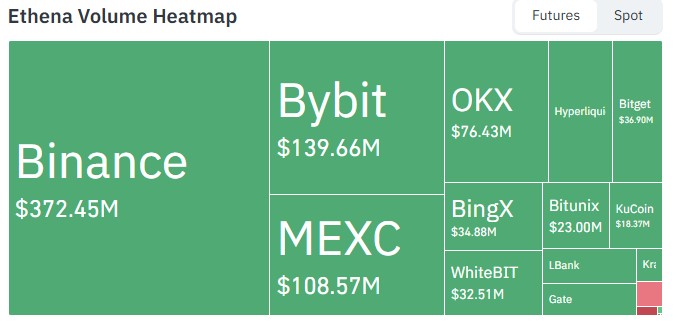
Binance leads futures volume with $372.45M, then Bybit at $139.66M and MEXC at $108.57M. Binance holds about 44% of the $842.77M across 9 labeled venues.
$ENA open interest stands at $926.772M. And a leveraged market reacts fast, which matters for any Ethena price analysis.
Ethena Price Prediction November 2026: 1-Day Chart Analysis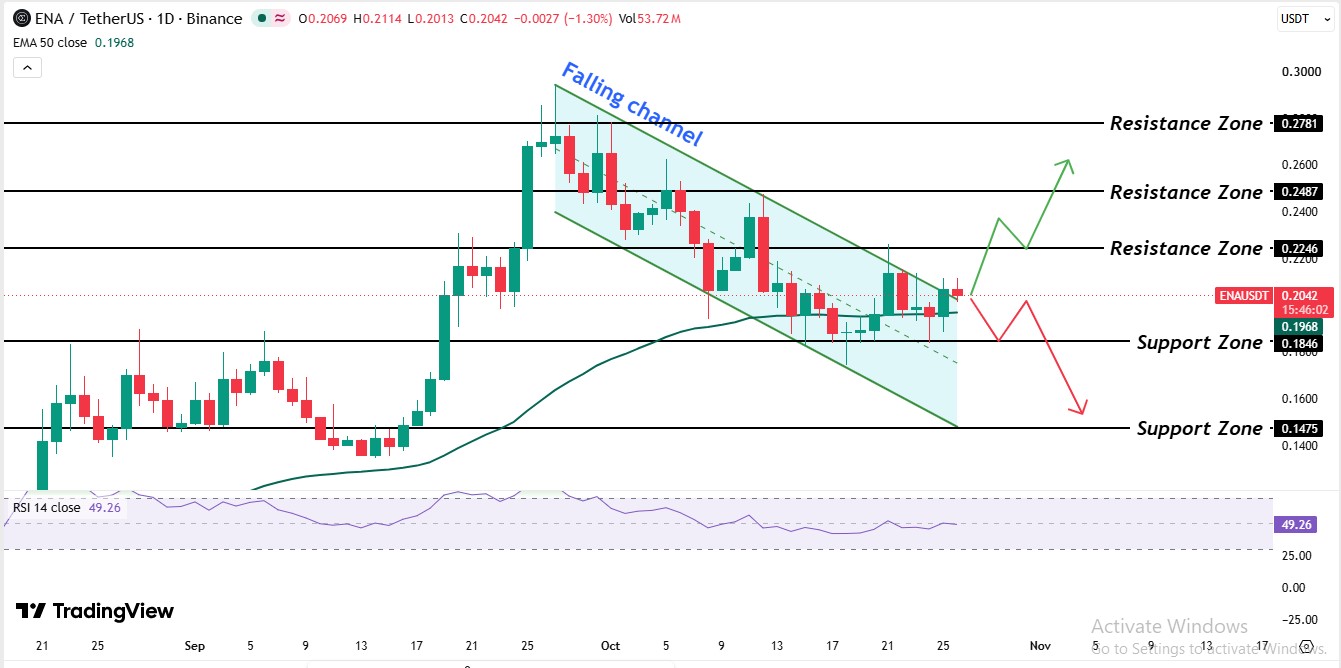
This Ethena Price Prediction November 2026 starts with the base. From Sep 1 to Sep 17, 2026, $ENA chopped sideways between roughly $0.14 and $0.18.
Price then jumped between Sep 16 and Sep 26, 2026, and peaked near $0.29. After that, the price started falling and moved in a falling channel, a pair of sloping lines where each high and low sits lower than the last.
EMA 50 (moving average of the last 50 daily prices that weighs recent days more). It sits at $0.1968, and price trading above it means dips keep finding buyers near that line.
RSI (relative strength index) is 49.26 and sits at dead center, so neither side owns the move.
On Oct 25, 2026, the price broke the falling channel and traded above the channel trendline on the daily candle.
Ethena Support and Resistance Levels
Type | Level |
Resistance | $0.2781 |
Resistance | $0.2487 |
Resistance | $0.2246 |
Support (EMA 50) | $0.1968 |
Support | $0.1846 |
Support | $0.1475 |
Ethena Price Forecast: Bull, Base, and Bear Scenarios
The bull path echoes the earlier ENA breakout target idea. It needs a daily trade above $0.2246 first.
Scenario | Trigger | Target | Invalidation |
Bull | Daily trade above $0.2246 | $0.2487, then $0.2781 | Daily trade below $0.1968 |
Base | Range between $0.1846 and $0.2246 | $0.2039 area | Break of either edge |
Bear | Daily trade below $0.1846 | $0.1475 | Daily trade above $0.2246 |
Ethena Price Prediction November 2026: Expert Outlook
As per the CoinGabbar analysis, the setup leans bullish, but a falling channel breakout needs confirmation. Price trades above the EMA 50, and the price is also trading above the channel treadline.
But RSI at 49.26 hasn't confirmed anything. A daily trade below $0.1846 would flip this Ethena price prediction November 2026 to bearish, with $0.1475 as the next stop.
And whales hold 97.70% of the market cap, so one large transfer could change the setup. Traders can scan the latest crypto news before acting.
Disclaimer: This article is for information only and isn't financial advice. Crypto assets are highly volatile, and prices can move sharply in either direction. Readers should do independent research and consider their own risk tolerance before making any decision.

















