Ethereum (ETH) Tests $2,300 as Fed Holds and Bears Eye the Trendline


Ethereum is trading near $2,315, down 1.57% in 24 hours. The price is sitting just above the $2,300 support level while the wider crypto market cools.
Traders are watching a rising trendline that has held since late June.
Crypto Market Slips After Fed Holds Rates at 3.75% to 4%
The US Federal Reserve left rates unchanged on October 28, 2026. The fed funds target range stays at 3.75% to 4%.
The Fed's tough tone a day earlier added pressure on risk assets.
Total crypto market cap fell 0.77% to $2.69 trillion. Bitcoin slipped below $80,000, while $ETH held above $2,300.
ETH Price Action Today: Key Market Data
Metric | Value |
Price | $2,315.05 |
24h change | -1.57% (-$36.93) |
Market cap | $282.48 billion |
Futures volume (24h) | $40.01 billion |
Spot volume (24h) | $1.92 billion |
Circulating supply | 122.17 million ETH |
Futures trading is far larger than spot trading. That shows most of the action is in derivatives right now.
ETH Technical Analysis: Trendline Support Under Test
So far, yes. The daily Binance chart shows $ETH testing the $2,300 to $2,320 zone, where the rising line from early July meets the price.
Today's candle dipped to $2,293.44 and closed near $2,315.01, down 1.89%. ETH topped out near $2,800 in September before sliding.
The price now sits below the 20-day and 50-day EMAs. The RSI is at 34.92, under its signal line at 38.09. That points to weak momentum.
ETH Key Support and Resistance Levels to Watch
Level | Price | Role |
200-day EMA | $2,319.56 | Current test |
100-day EMA | $2,361.77 | First hurdle |
20-day EMA | $2,414.85 | Resistance |
50-day EMA | $2,445.68 | Resistance |
Round number | $2,500 | Resistance |
Support zone | $2,280 to $2,250 | Key floor |
Lower support | $2,200 | Next stop if floor breaks |
A bounce could reach $2,360 to $2,415 first. A daily close under the trendline and the $2,280 to $2,250 zone would weaken the bullish case.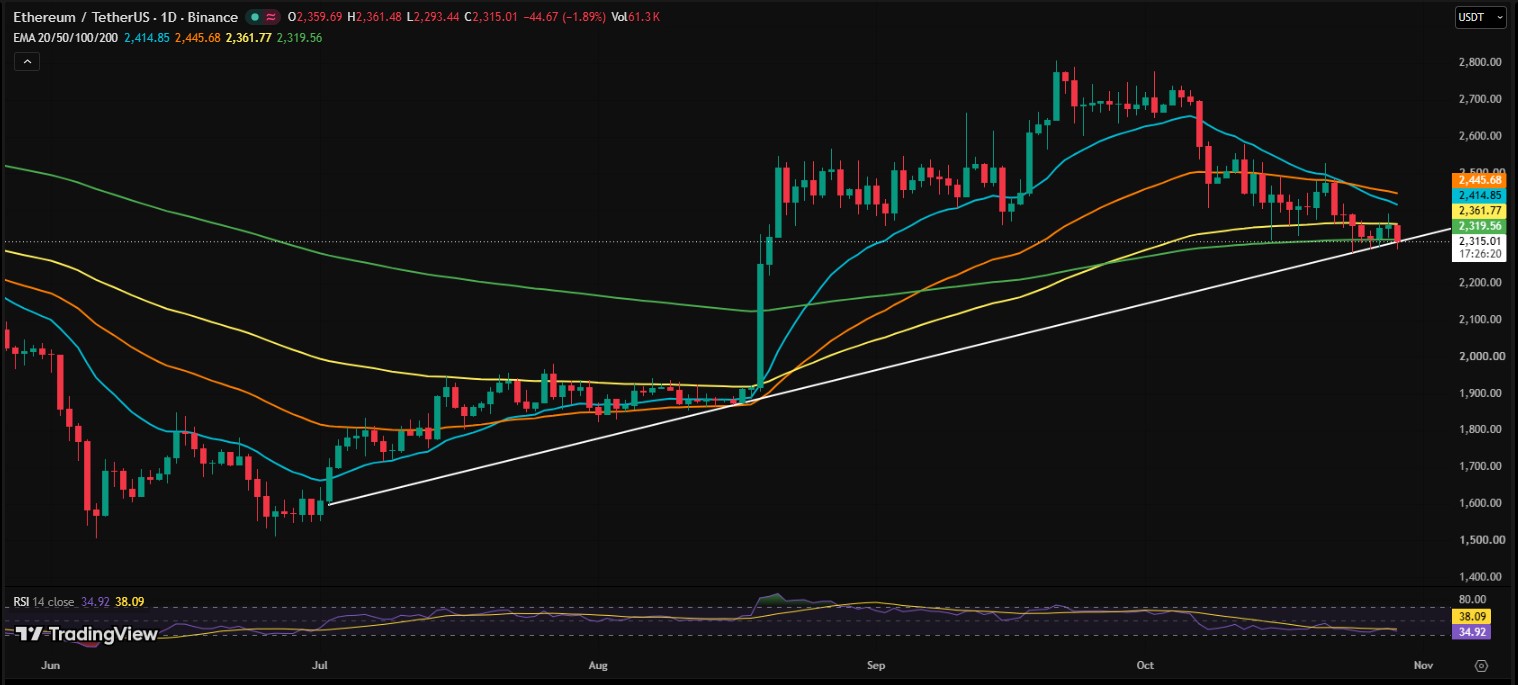
ETH ETF Flows Turn Negative as BlackRock Sees Outflows
As per SoSoValue, Spot ETH ETFs saw net outflows of $21.41 million on October 28. Cumulative net inflows still stand at $12.55 billion.
Total net assets are $14.27 billion, or 4.95% of ETH's market cap.
Fund | Sponsor | Daily flow |
ETHA | BlackRock | -$44.83M |
FETH | Fidelity | +$18.78M |
ETH | Grayscale | +$3.62M |
MSSE | Morgan Stanley | +$1.02M |
BlackRock's ETHA led the outflows. Most other funds reported no flows. Short-term selling may be profit-taking or plain caution.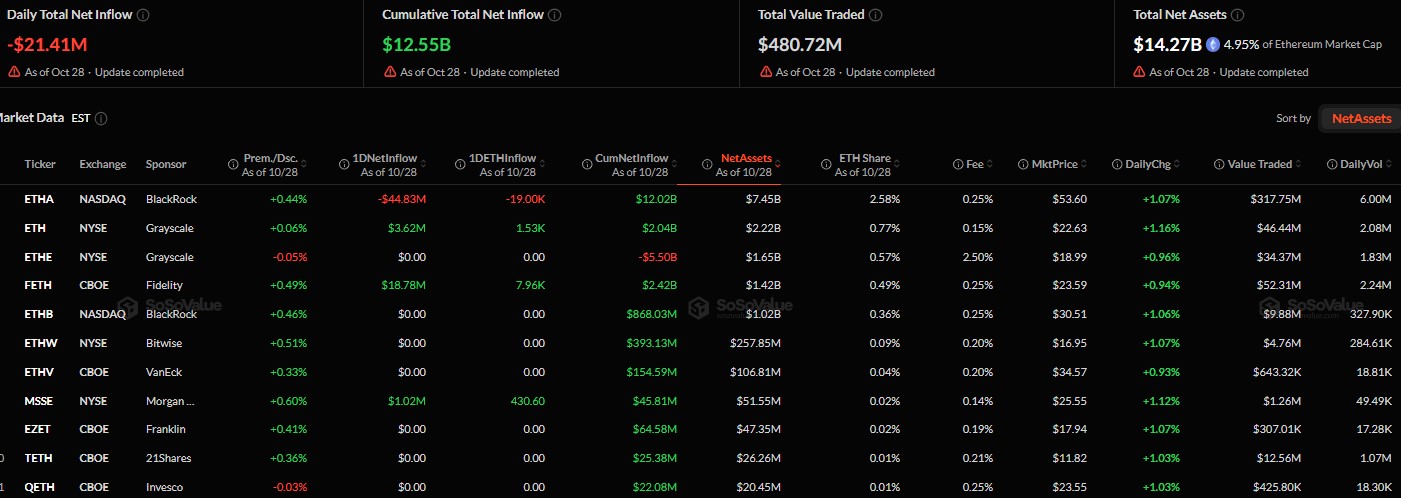
Derivatives Data: $80.34M Liquidated in 24 Hours
Open interest is $29.83 billion, down 0.78%. Options volume jumped 45.60% to $1.88 billion.
The overall long/short ratio is 0.9904, close to balanced. Binance accounts lean long at 3.4683, and OKX sits at 2.71. Top traders on Binance show 1.8945 by position.
Window | Total rekt | Longs | Shorts |
1 hour | $699.72K | $695.70K | $4.02K |
4 hours | $13.68M | $5.29M | $8.39M |
12 hours | $57.20M | $29.46M | $27.74M |
24 hours | $80.34M | $39.06M | $41.27M |
Shorts lost slightly more over 24 hours. Longs took almost all of the latest hour.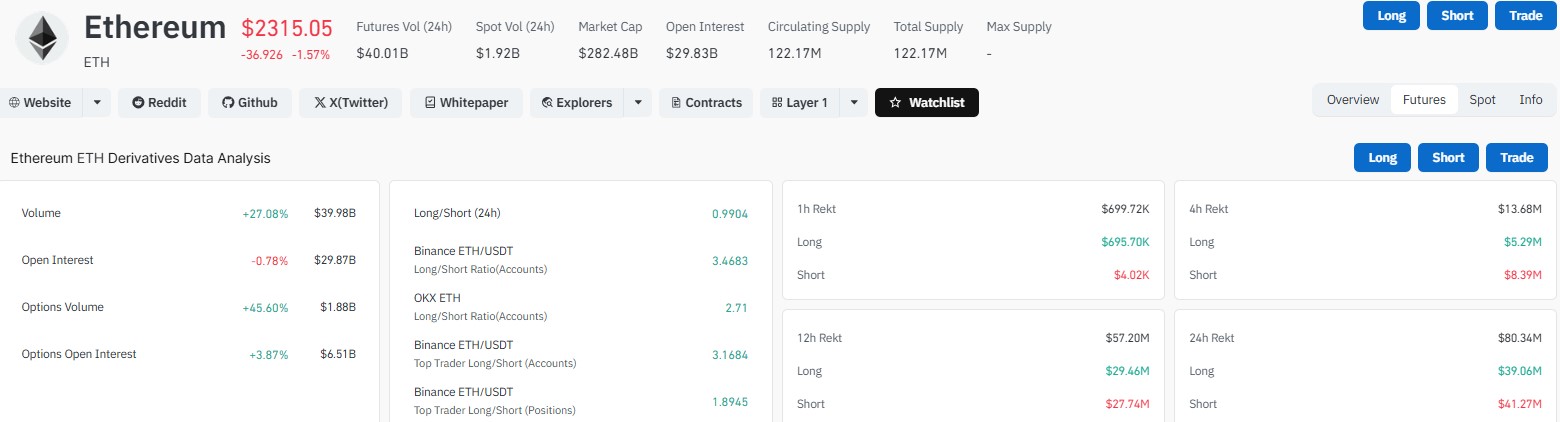
Analyst View: Javon Marks Eyes Rebound Toward $4,811
Analyst Javon Marks says ETH support is holding. He sees a recovery of over 102% toward $4,811.71 and the all-time highs.
He adds that a break above that level could extend toward $8,500 or more. That is a long-range view. The daily chart still has work to do first.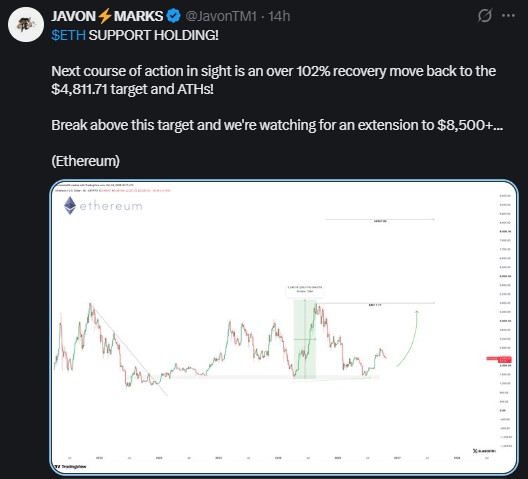
Ethereum Outlook: Relief Rally or Break Below $2,250?
Nobody knows. The trendline is intact, but momentum is soft, and the EMAs sit above the price.
A relief rally needs stronger volume and a move back over the EMA cluster. Losing $2,250 would shift focus to $2,200.
Disclaimer
This article is for information only and is not financial advice. Crypto assets are volatile, and you can lose money. Do your own research and speak with a licensed advisor before making any investment decision.



















