Ethereum Price Prediction: Will ETH Bounce or Break Below $1,700?


This Ethereum price prediction starts with a weak chart. $ETH trades near $1,812 today, up just 0.29% in 24 hours.
The price is far below its September peak near $2,800. Market cap is $221.21 billion, and ETH sits 63.4% under its all-time high of $4,953.7.
Mood is poor. The Fear & Greed Index reads 11, which means extreme fear.
Metric | Data (Nov 18, 2026) |
ETH Price | $1,812.6 |
24h Change | +0.29% |
24h Low / High | $1,750.1 / $1,835.5 |
Market Cap | $221.21B |
24h Spot Volume | $2.43B (+12.85%) |
24h Futures Volume | $35.96B (+11.82%) |
Daily RSI (14) | 25.48 |
Fear & Greed Index | 11 (Extreme Fear) |
Ethereum Price Prediction: Chart Still Leans Bearish
On the daily chart, ETH sits under all four key moving averages. That is a clear downtrend.
The 20 EMA is at $2,047. The 50 EMA is at $2,226, the 100 EMA at $2,265, and the 200 EMA at $2,275.
The RSI sits at 25.48, a deeply oversold reading. Trader Tardigrade noted that ETH gave a similar signal in June.
Back then, price bounced, then retested the same low before moving higher. A repeat is possible. It is not guaranteed.
ETH Support and Resistance Levels to Watch
A rising trendline near $1,700 to $1,750 is the key support. The 24-hour low of $1,750.1 sits just above it.
A daily close under $1,700 could open the way to $1,600, then $1,500.
Level | Type | What It Means |
$2,047 | Resistance | 20 EMA, first trend test |
$1,900 to $2,000 | Resistance | Needed for early recovery |
$1,750 to $1,700 | Support | Trendline and recent low |
$1,600 | Support | Next stop if $1,700 breaks |
$1,500 | Support | Deeper downside zone |
Futures Data Shows Mixed Signals
Open interest grew 1.49% to $23.02 billion. That equals 10.41% of ETH's market cap.
Futures volume is about 14.8 times spot volume. Traders are using leverage heavily.
The funding rate is slightly positive at 0.0021%, or 2.3% annualized. That hints at a small long bias.
The Binance perp basis is negative at 0.051%, though. That points to caution.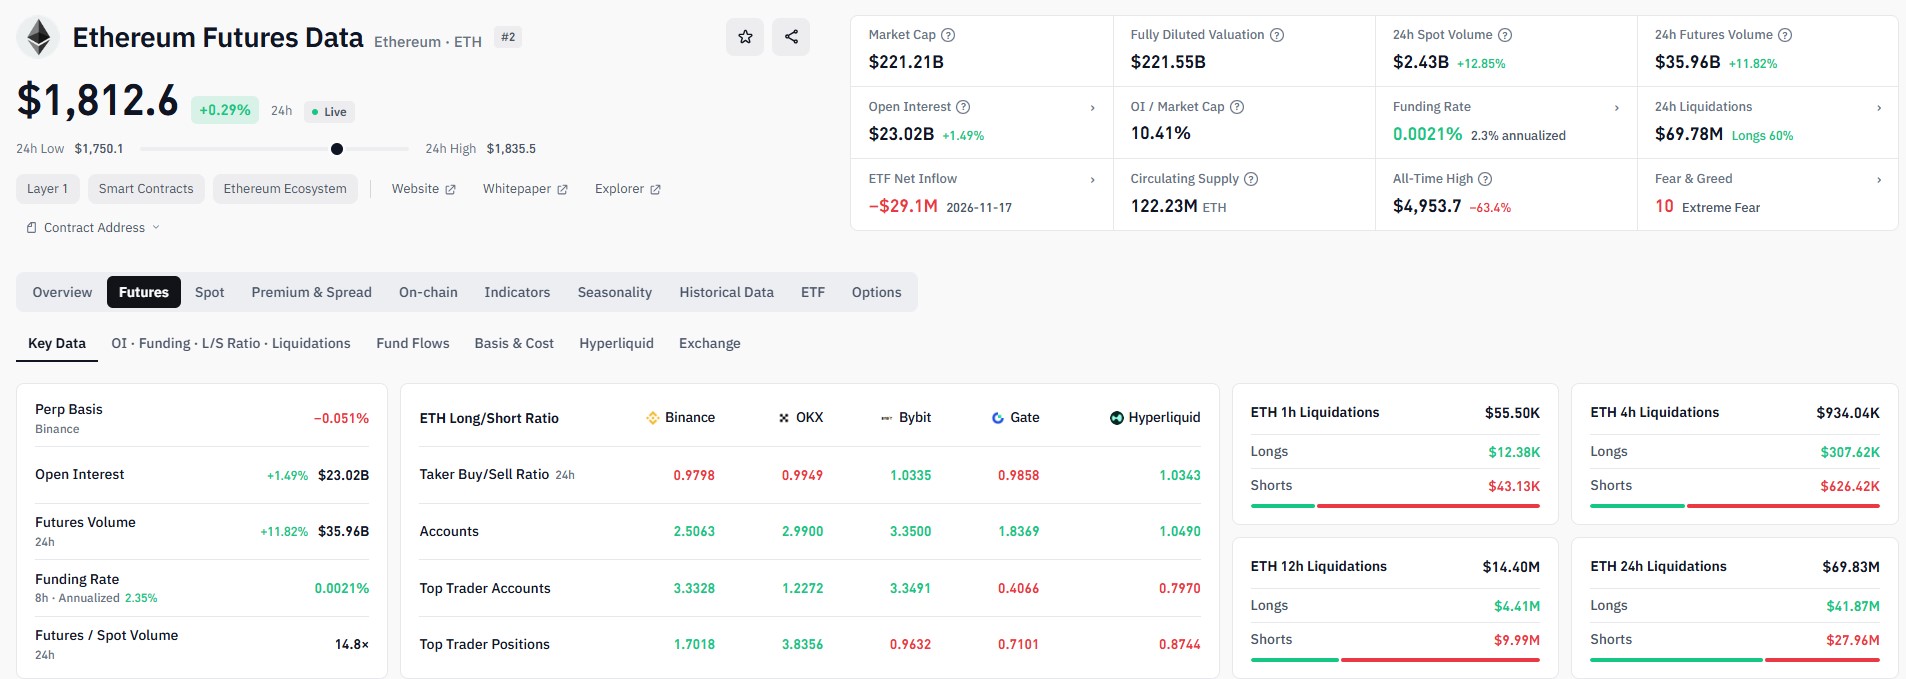
Exchange Positioning Is Split
Traders do not agree on direction. The data differs from one exchange to the next.
A taker buy/sell ratio under 1 means sellers are a bit more active. Binance, OKX and Gate sit below that line.
Bybit and Hyperliquid are slightly above it. Top trader positions also vary, with Binance and OKX leaning long.
Exchange | Taker Buy/Sell (24h) | Top Trader Positions L/S |
Binance | 0.9798 | 1.7018 |
OKX | 0.9949 | 3.8356 |
Bybit | 1.0335 | 0.9632 |
Gate | 0.9858 | 0.7101 |
Hyperliquid | 1.0343 | 0.8744 |
ETH Liquidations Flip in Recent Hours
Over 24 hours, longs lost $41.87 million while shorts lost $27.96 million. Longs made up about 60% of the $69.78 million total.
The short-term picture looks different. In the last 12 hours, shorts lost more, at $9.99 million against $4.41 million for longs.
That fits the small bounce from the lows. It does not prove a trend change.
Window | Long Liquidations | Short Liquidations |
1 hour | $12.38K | $43.13K |
4 hours | $307.62K | $626.42K |
12 hours | $4.41M | $9.99M |
24 hours | $41.87M | $27.96M |
ETF Flows Add Short-Term Pressure
As per SoSoValue, Spot Ethereum ETFs saw $29.09 million in net outflows on November 17. Total value traded was $559.61 million.
BlackRock's ETHA led the exits with $27.60 million. Its ETHB fund lost $2.77 million.
Bitwise's ETHW was the only listed fund with inflows, at $1.28 million.
The bigger picture is steadier. Cumulative inflows remain at $11.49 billion. Total net assets are $9.97 billion, or 4.53% of ETH's market cap.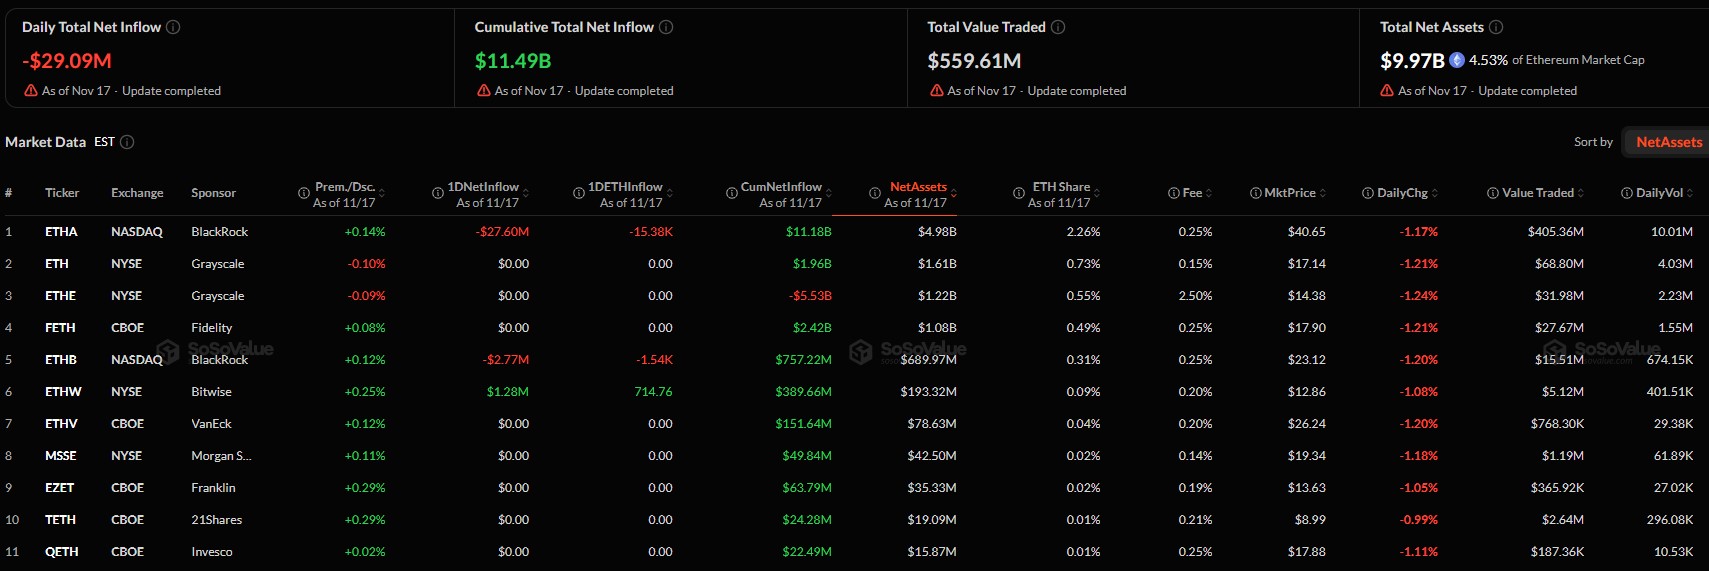
ETF Data (Nov 17) | Figure |
Daily Net Flow | -$29.09M |
Cumulative Net Inflow | $11.49B |
Total Net Assets | $9.97B |
ETHA Net Assets | $4.98B |
Grayscale ETH Net Assets | $1.61B |
Grayscale ETHE Net Assets | $1.22B |
ETHA Daily Flow | -$27.60M |
Long-Term View: Is $1,000 the Floor?
Analyst Crypto Patel sees $1,000 to $1,500 as a major accumulation zone. He calls $1,000 critical support.
His chart marks 2027 to 2028 as a possible cycle top. He lists $10,000 to $16,000 as long-term targets.
He also says altseason may not be finished. His advice is to build conviction, not chase euphoria.
That view leans on past Bitcoin halving cycles. Old patterns do not always repeat, so treat it as one opinion.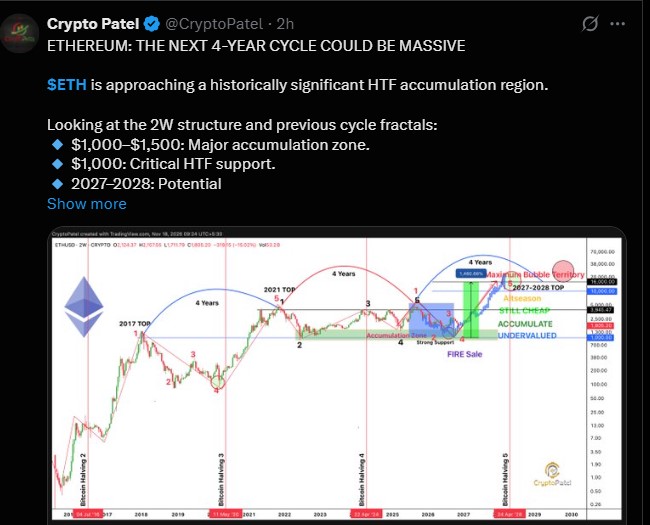
ETH Price Scenarios
Scenario | Trigger | Possible Target |
Bullish | Support holds, ETH reclaims $1,900 to $2,000 | $2,047 |
Neutral | Price stays between support and resistance | $1,700 to $1,900 |
Bearish | Daily close below $1,700 | $1,600, then $1,500 |
What Comes Next for Ethereum?
The short-term outlook stays bearish. Still, an oversold RSI leaves room for a bounce.
Buyers must defend $1,700 first. After that, $2,000 is the zone to reclaim.
If support fails, a deeper drop is on the table. The altcoin may stay choppy until one side wins.
Disclaimer
This article is for information only and is not financial advice. Crypto prices are volatile, and you can lose money. Do your own research before you invest.
















