Ethereum Slips Below $2,500 as ETF Outflows Hit $542M: What Next?


This Ethereum price looks at a rough week. The coin is down more than 7% in the past seven days.
Spot ETH ETFs just had their worst week since January. Still, the chart and a few data points give buyers something to hold onto.
ETH Price Today: How Much Is ETH Trading for on October 10?
ETH price today sits near $2,496, down 0.26% in 24 hours. The last daily candle on Binance closed near $2,497.
Trading volume also dropped. It fell 63% to $6.89 billion, per CoinMarketCap. Lower volume often means fewer traders are placing big bets.
Metric | Latest Data |
ETH price | $2,496 |
24-hour change | -0.26% |
7-day change | More than -7% |
24-hour trading volume | $6.89 billion (down 63%) |
Daily RSI (14) | 40.12 |
Weekly ETF flows | -$542.07 million |
Why Is ETH Price Falling This Week?
Weak ETF demand is the main story. SoSoValue data shows spot ETH ETFs lost $542.07 million in the week ended October 9.
That is the biggest weekly outflow since late January 2026.
BlackRock's ETHA fund led the exits with $477 million. It was ETHA's largest weekly outflow since December 2025.
Farside data also showed a sixth straight day of ETH fund outflows on October 6. Bitcoin funds took in money on the same day.
From October 4 to October 8, ETH fell about 10%. BTC fell about 6%.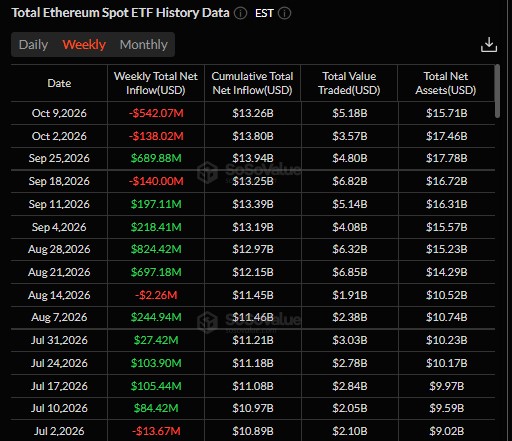
Is ETH Moving to Exchanges? What the Data Shows
Santiment data says ETH on exchanges rose by over 100,000 ETH, nearly 2%, between October 4 and October 8.
BTC on exchanges fell by about 15,000 BTC in the same window. In plain words, bitcoin was leaving exchanges while ether was heading back.
Coins moving to exchanges can mean some holders are ready to sell. It is not proof, though. People move coins for many reasons.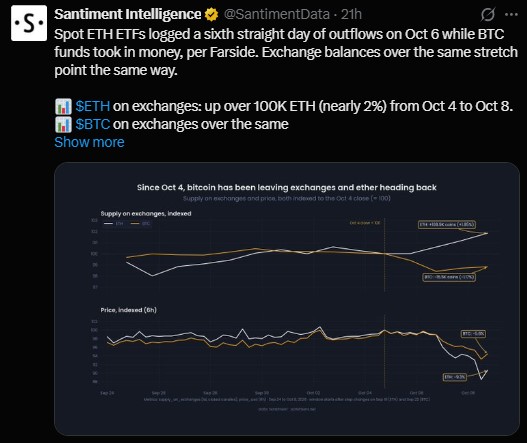
Ethereum News Today: Grayscale Mini ETH Fund Buys $103M
Not all Ethereum news today is negative. Arkham reports that Grayscale's Mini ETH fund bought $103.3 million of ETH over the past 20 days.
Its older ETHE fund saw $71.6 million in outflows over the same period. That looks like a rotation from the old fund into the Mini fund.
Grayscale clients net bought $31.7 million of ETH. So not every large holder is leaving. Some are just switching products.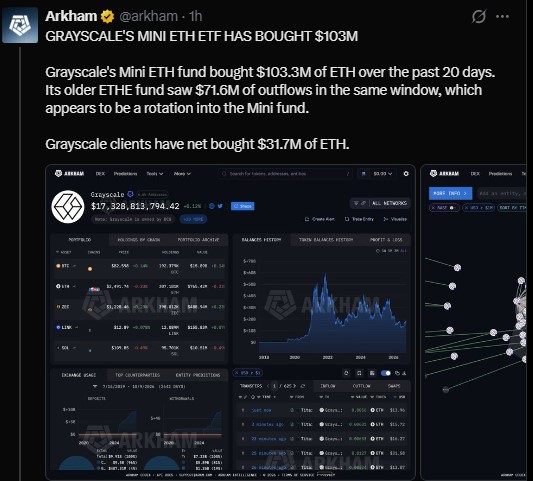
Ethereum Price Forecast: Will ETH Hold the Rising Channel?
On the daily chart, ETH is retesting the lower edge of a rising channel. That line sits roughly near $2,400.
Price reclaimed this area recently. Buyers now need to defend it to keep the bullish structure alive.
RSI is at 40.12, close to a four-month low. That points to weak momentum.
Some chart watchers say ETH is repeating a range pattern that broke higher three times before. Past patterns do not guarantee the same result, though.
ETH Price History: Which Past Levels Matter Most?
The chart circles five turning points. All numbers below are rough readings from the chart.
Date on Chart | Approx. Level | Type |
Mid-2022 | About $900 | Cycle low |
March 2024 | About $4,100 | Local high |
April 2025 | About $1,400 | Cycle low |
August 2025 | About $5,000 | Cycle high |
June 2026 | About $1,500 | Low on long-term support |
The low points all touch the same rising support line. The highs stall near the top line around $5,000.
ETH Price Prediction: What Are the Key Support and Resistance Levels?
Here are the main levels traders are watching right now.
Level | Type | What It Means |
About $2,400 | Channel support | Lower channel line under retest |
$2,800 to $3,000 | Resistance | First area in focus if the retest holds |
$1,600 to $1,000 | Major support | Long-term historical support zone |
$4,500 to $5,000 | Resistance | Previous cycle high area |
If the channel holds, $2,800 to $3,000 comes back into view. If it breaks, the next big support sits much lower, in the $1,600 to $1,000 zone.
Nothing here is certain.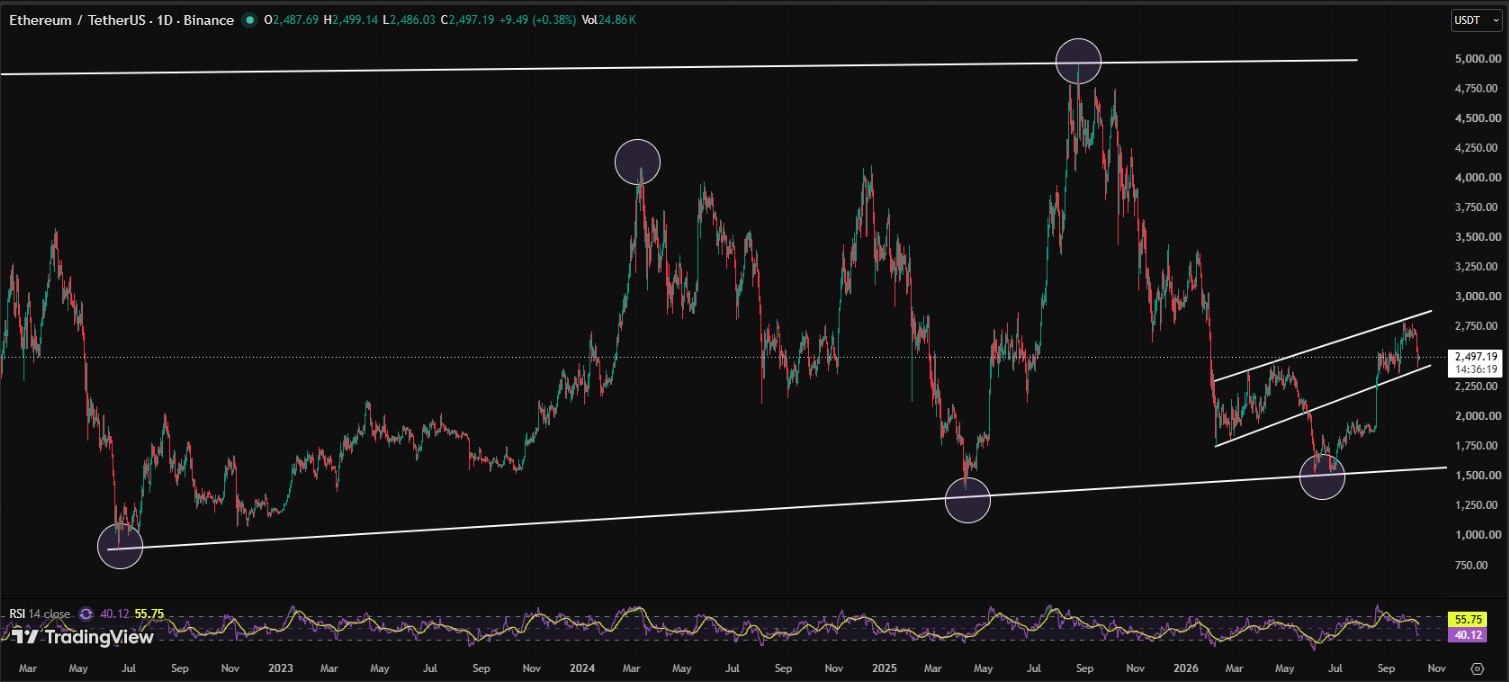
ETH Price Forecast: Can ETH Reach $50,000 in the Long Term?
One popular view calls the long-term channel a macro Elliott Wave setup. It points to a possible fifth-wave move higher.
The targets in that view are $14,000 for a wave 3 extension and $50,000 for a macro wave 5.
These are far-off ideas, not forecasts anyone can count on. ETH's last cycle high was near $5,000, and it trades near $2,496 today.
Disclaimer
This article is for information only and is not financial advice. Crypto prices swing fast, and you can lose money. Price targets and chart patterns are opinions, not promises. Do your own research and talk to a licensed financial adviser before you invest.

















