Fear and Greed Index Explained: What Does a Score of 71 Mean?

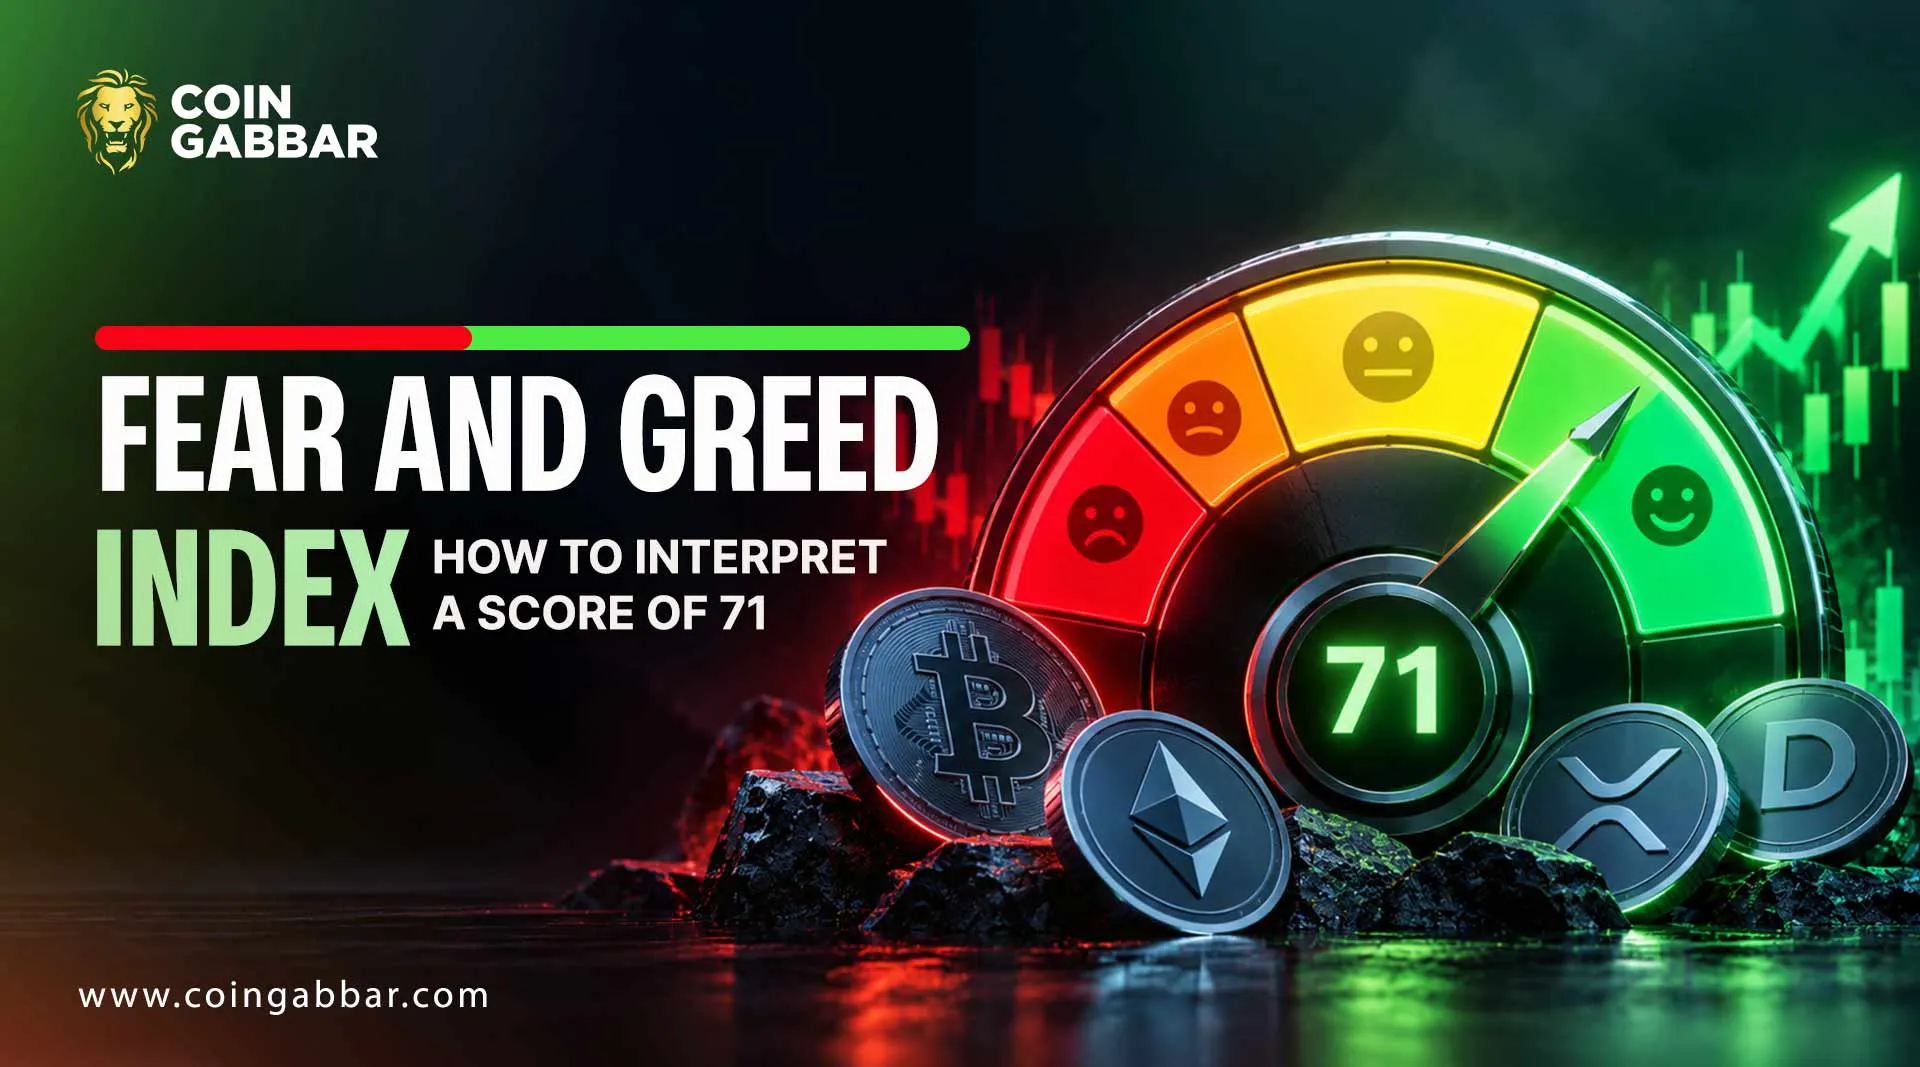
Fear and Greed Index Explained: What a 71 Score Means
A single number can make a market feel simple. The Fear and Greed Index does exactly that, turning crowd mood into a score from 0 to 100. A reading of 71 sounds bullish, but what it actually says is narrower.
This guide explains the Fear and Greed Index, what a 71 means, and how to use it without overreading it.
A 71 on the Fear and Greed Index sits in the greed band, below extreme greed. It describes recent sentiment, not future price, and it can change within days.
What the Index Is
The most widely quoted Fear and Greed-Index for crypto. It covers Bitcoin only, and its public history starts in February 2018.
a separate index for US stocks, which uses different inputs. Other crypto providers use their own recipes, so readings differ.
In October 2025, for example, a report read 64, while CoinMarketCap read 54, according to the educational summary.
How the Score Is Built
Input | Weight | What it captures |
Volatility | 25% | Price swings versus recent averages |
Momentum and volume | 25% | Buying pressure and activity |
Social media | 15% | Posting and engagement trends |
Surveys | 15% | Paused, according to Banxa |
Bitcoin dominance | 10% | Share of the total market |
Google Trends | 10% | Search for interest in Bitcoin terms. |
Each input in the Fear and Greed-Index is compared with its own recent behavior, then blended into one number.
The weights come from published descriptions of the method, so check the current recipe.
The Bands
Score | Label |
0 to 25 | Extreme fear |
25 to 45 | Fear |
45 to 55 | Neutral |
55 to 75 | Greed |
75 to 100 | Extreme greed |
Providers draw the bands of the Fear and Greed Index slightly differently, so edges can shift by a point or two.
What a 71 Score Means
A 71 on the Fear and Greed Index means that, by its own measures, sentiment is clearly optimistic but not euphoric.
It sits about four points below extreme greed. That tells readers the mood is warm. It does not say prices will rise or fall next.
One report noted a reading of 71 in August 2026. Another report mentioned a reading near 74 before the October 2025 sell-off, but a single episode is not a rule.
Strong readings have also lasted for weeks without a drop. The Fear and Greed Index labels what has already happened.
How Fast It Swings
Recent readings of the Fear and Greed Index show how jumpy the score itself can be. Press and educational pages reported 54 in October.
That is an 18-point swing in a day while prices moved only a few percent. So the Fear and Greed-Index measures mood, not price, and a 71 can be gone by next week.
Using the Index Sensibly
Context first: pair it with price trends and your own plan.
Look at direction: a rise from 40 to 71 means something different from a fall from 90.
Check the date: old readings mislead.
Compare providers: two sources can disagree by ten points or more.
Avoid timing games: the Bitcoin DCA strategy guide shows one way to reduce reliance on sentiment calls.
Mind leverage: the Bitcoin futures guide explains why mood-based bets can be costly.
Common Mistakes
Treating 71 as a sell signal: greed can persist.
Treating fear as a buy signal: fear can deepen.
Ignoring methodology: a paused input or new weight changes the meaning.
Confusing indexes: the CNN stock version and the crypto version are different tools.
Many errors with the Fear and Greed Index come from treating a mood gauge as a forecast.
Security and Risk Checks
Fake dashboards: scam sites copy sentiment charts to lure wallet connections. The Bitcoin scams guide lists warning signs.
Hype posts: claims that the Fear and Greed Index "guarantees" a move are marketing.
Market noise: a Bitcoin price update tells a different story from sentiment.
Jargon: the crypto dictionary explains unfamiliar terms.
Method limit: this guide reflects source reading, not independent measurement, and is not financial advice.
Final Thoughts
The Fear and Greed Index is a quick way to see how the crowd is feeling. It boils a bunch of market signals down to one number between 0 and 100, and a reading of 71 shows.
That tells you optimism is running high. It doesn't tell you a top is close, and it certainly doesn't promise the rally will keep going.
Sentiment can stay upbeat for weeks, sometimes months, and prices do their own thing regardless of mood.
So how do you actually use it well? Start by checking the date on the reading. Sentiment moves fast, and an old number can send you in the wrong direction.
Next, look at more than one provider. Each of them calculates the score differently, so don't be surprised if the numbers don't match.
And finally, pair it with your own rules: how much you're willing to risk, where you'd cut a loss, and how long you plan to hold.
Think of the index as one input, not the whole decision. It's a thermometer, not a crystal ball. It can tell you how the market feels today, but it can't tell you where prices will be tomorrow. Your own plan should do the heavy lifting.
Disclaimer: This article is educational information about the Fear and Greed Index, not financial or investment advice. Crypto assets are volatile and can lose all value. Index readings change daily and differ by provider. Verify data at the source and consult a qualified professional.
















