FLOKI Price Prediction 2026: Is FLOKI Ready for Another Breakout?


A chart that barely moves can still carry weight. This one does.
FLOKI spent most of 2026 boxed inside a falling channel. A recent push above that channel has already started losing steam, and that's the real story behind this FLOKI Price Prediction Today update, not the bounce itself.
And that part rarely makes the headline.
Why Is FLOKI (FLOKI) Price Moving Today?
Nothing loud triggered this move. That's the point.
FLOKI trades near $0.00002444 as of September 13, 2026, near 14:55 UTC, down 1.73% to 1.81% across the day, per CoinMarketCap price data and Coinglass market tracking.
Twenty-four-hour volume dropped 53.58% against the prior session. No fresh catalyst is pushing this. It's fading off an earlier spike, not gearing up for one.
FLOKI Market Snapshot
Market cap sits near $232.8 million, with a fully diluted valuation at $244.42 million.
Circulating supply reads 9.52 trillion FLOKI against a max supply of 10 trillion, per the FLOKI market cap tracker. Holder count stands near 559.96K wallets, carrying a profile score of 74%.
Volume-to-market-cap sits at 3.9%, and liquidity-to-market-cap reads 7.30%. Any honest FLOKI crypto forecast has to flag that thin volume ratio before calling this move a real trend shift.
FLOKI Technical Analysis: RSI Signals Neutral Momentum
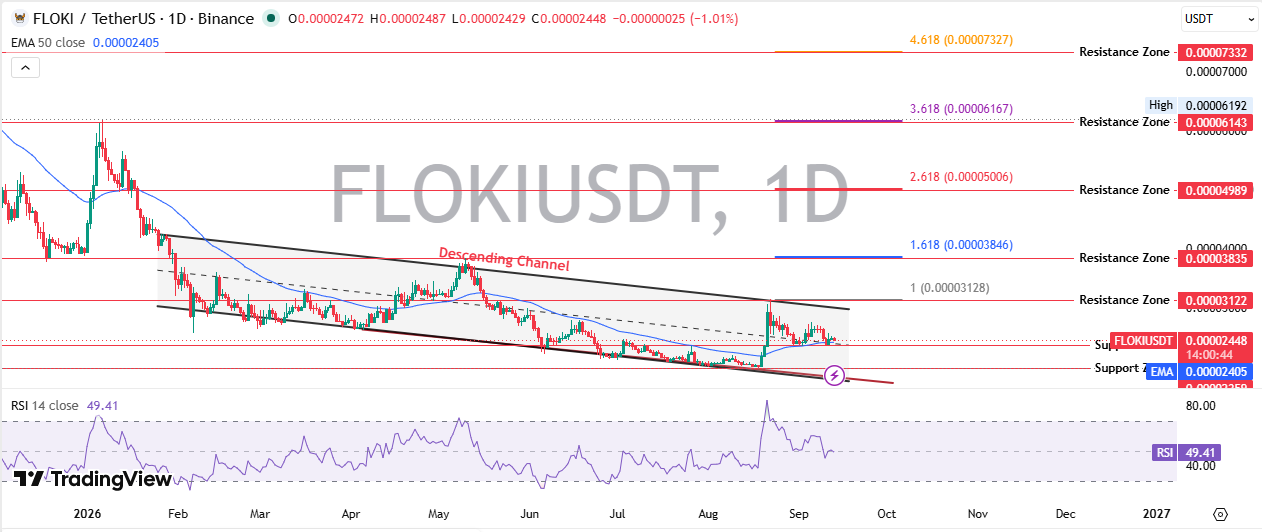
The price broke above a long descending channel earlier this month. It spiked toward the upper band, then slid right back toward its 50-period EMA near $0.00002405.
Not overbought. Not oversold either.
RSI sits at 49.41 on the daily timeframe, almost dead center of neutral, per the TradingView chart. Here's the thing: a bounce that fades this fast, this close to its own average, hasn't proven a trend change yet.
It looked like momentum shifting at first. It might just be noise inside the channel.
A pull of the trading data across timeframes shows a clear split: down 7.29% over seven days, up 19.84% over thirty days, and down 24.82% across six months.
FLOKI Support and Resistance Levels
Support stacks near $0.00002405, the current 50 EMA zone, with the 24-hour low sitting at $0.00002429.
Fibonacci extensions place resistance at $0.00003122, $0.00003835, $0.00004989, $0.00006143, and $0.00007332. Turns out, most FLOKI Support Resistance Levels setups hinge on clearing that first band near $0.00003122.
Fail there, and the earlier breakout stops mattering.
FLOKI Circulating Supply and Holder Data
Supply isn't the overhang; it is for some tokens.
Circulating supply already covers 9.52 trillion of a 10 trillion cap, leaving a small unlock buffer, not a looming flood. That trims one risk category. But it doesn't touch concentration risk, and that one's real.
Whale and Exchange Wallet Concentration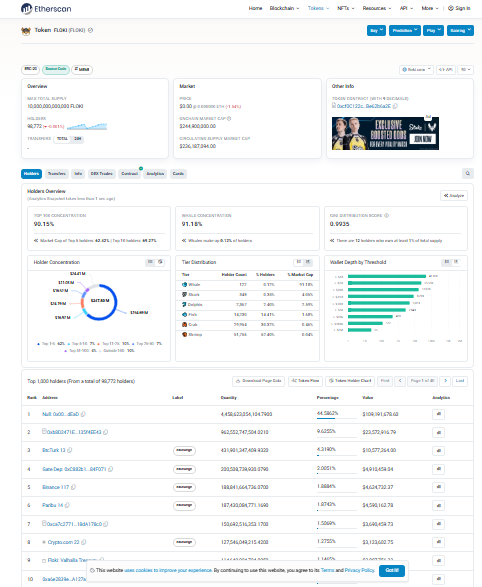
Etherscan holder tracking shows the top 10 wallets controlling 90.15% of supply, with whale-classified wallets holding 91.18%. The fair distribution score reads 0.9935, about as tight as concentration gets.
Basically, a small circle of large wallets controls most of the float that actually trades.
FLOKI Liquidation Data: Breaking Numbers
Liquidations stayed thin across every window tracked.
Twenty-four-hour liquidations totaled $85.99, with one-hour, four-hour, and twelve-hour windows reading the same figure, per Coinglass liquidation data. Almost all of it hit long positions.
Small numbers. Nothing forced here.
Exchange and Futures Volume Activity
BingX and LBank lead recent volume at $2.60 million and $2.18 million. MEXC follows near $1.11 million, with OKX trailing around $334.35K.
And that spread across several mid-sized exchanges means price can jump fast if one venue's funding rate flips.
FLOKI Price Prediction 2026: Bull, Base and Bear Case
This FLOKI Price Prediction table ties targets to the chart's own Fibonacci resistance and current support structure.
Timeframe | Bear Case | Base Case | Bull Case |
7 Days | $0.0000215 | $0.0000240 to $0.0000260 | $0.0000312 |
30 Days | $0.0000190 | $0.0000230 to $0.0000290 | $0.0000384 |
Long Term | $0.0000150 | $0.0000250 to $0.0000400 | $0.0000614 |
Any serious FLOKI Price Forecast 2026 has to treat that first resistance band as the real test, not the recent spike high.
Key Risks to Watch
Thin trading volume against a $232.8 million market cap means moves can overshoot in either direction. Whale concentration above 90% adds a second layer on top of that.
Volume fell by more than half in a single day. That's not a healthy sign for a breakout trying to hold ground.
But RSI at 49.41 leaves room before momentum gets stretched either way.
Market Sentiment and Outlook
Where does momentum head from a neutral RSI and fading volume?
Nowhere fast, most likely. This reads like consolidation, not a confirmed trend change, a pattern also showing up across the FLOKI price prediction setup after its 200 EMA rejection bounce.
And a token sitting near full supply, with heavy whale control and cooling volume, tends to drift until something forces a decision. A related breakout setup flagged a similar forty percent upside case worth tracking.
The chart will decide on its own time.
Longer-term context lines up with the July 2026 outlook, where this same channel structure first showed up.
Disclaimer
This article is for informational purposes only and doesn't constitute financial, investment, or trading advice. Crypto markets are highly volatile, and prices can shift within minutes.
Independent research and advice from a licensed financial advisor is recommended before any decision. Data here was captured on September 13, 2026, near 14:55 UTC, and may no longer be current at the time of reading.









.jpg)








