Gold and Silver Crash Badly: Is Bitcoin Next? Death Cross Warning


Key points
Gold touched $3,542.94 and silver fell to $41.92, both 14-month lows.
Bitcoin trades at $61,731, right on a long-term trendline.
A death-cross style EMA setup has formed on the daily chart.
Fear and Greed is at 12, and Fed rate hike bets are growing.
Gold and Silver crashed this week, and crypto traders are asking one thing. Is Bitcoin next?
Gold broke below $3,600 and hit $3,542.94, down $82.24 or 2.27%. Silver fell to $41.92, down 2.20%. Gold is about 35% below its record high. Silver is over 65% below its own.
The Kobeissi Letter says the two metals have lost a combined $15 trillion in market cap.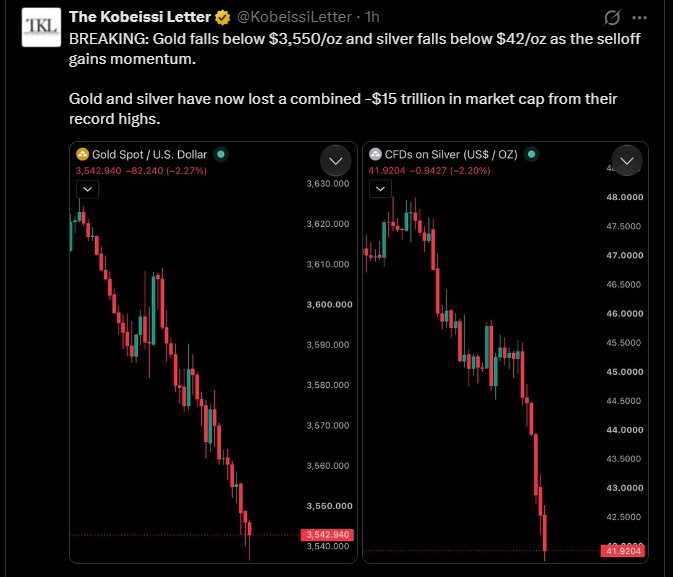
Bitcoin slid below $62,000, down about 24% in a month. It hit nearly $61,300 on Thursday, its lowest since early July. Ether ($1,730), XRP and Solana also traded weak.
Why Gold and Silver Are Crashing
The Fed is one cause. October meeting minutes showed worry about sticky inflation. More policymakers back higher rates, and some called for a half-point move. Bets on a December hike have grown.
Higher rates lift the dollar and Treasury yields. That hurts Gold and Silver because neither pays interest.
A tech-led stock correction adds pressure. Investors sell assets to cover losses elsewhere.
Subburaj, quoted in the source report, says silver falls harder because of industrial demand and bigger swings. Rupee moves add another layer for Indian investors.
Is Bitcoin Next? The Numbers
Bitcoin is down about 29.3% from a late-September peak near $87,000. It is 51.1% below its all-time high of $126,198.10.
A seventh straight weekly loss is on track. That would be the second-longest streak after nine weeks in 2022. The slide has erased about $20,000 since mid-October.
Metric | Reading |
Price / 24h change | $61,731 / -2.52% |
24h low / high | $61,255.60 / $64,056 |
Market cap / diluted value | $1.24T / $1.30T |
Spot volume (24h) | $6.25B, up 3.60% |
Futures volume (24h) | $81.70B, up 23.96% |
Futures to spot volume | 13.1x |
Open interest | $41.57B, down 1.07% |
Open interest to market cap | 3.35% |
Funding rate | 0.0020% (2.2% annualized) |
Perp basis (Binance) | -0.038% |
Supply | 20.11M of 21M BTC |
ETF net inflow, Nov. 19 | -$41.2M (partial) |
ETF outflows, November | $2.888B (SoSoValue) |
Fear and Greed Index | 12, extreme fear |
Liquidations lean heavily to longs.
Window | Total | Longs | Shorts |
1 hour | $905.04K | $809.84K | $95.20K |
4 hours | $37.83M | $25.97M | $11.86M |
12 hours | $157.75M | $131.34M | $26.41M |
24 hours | $194.53M | $154.46M | $40.07M |
Long/short ratios are mixed. Taker buy/sell is below 1 everywhere, so sellers lead. Account ratios are above 1 on most, which means more accounts are long.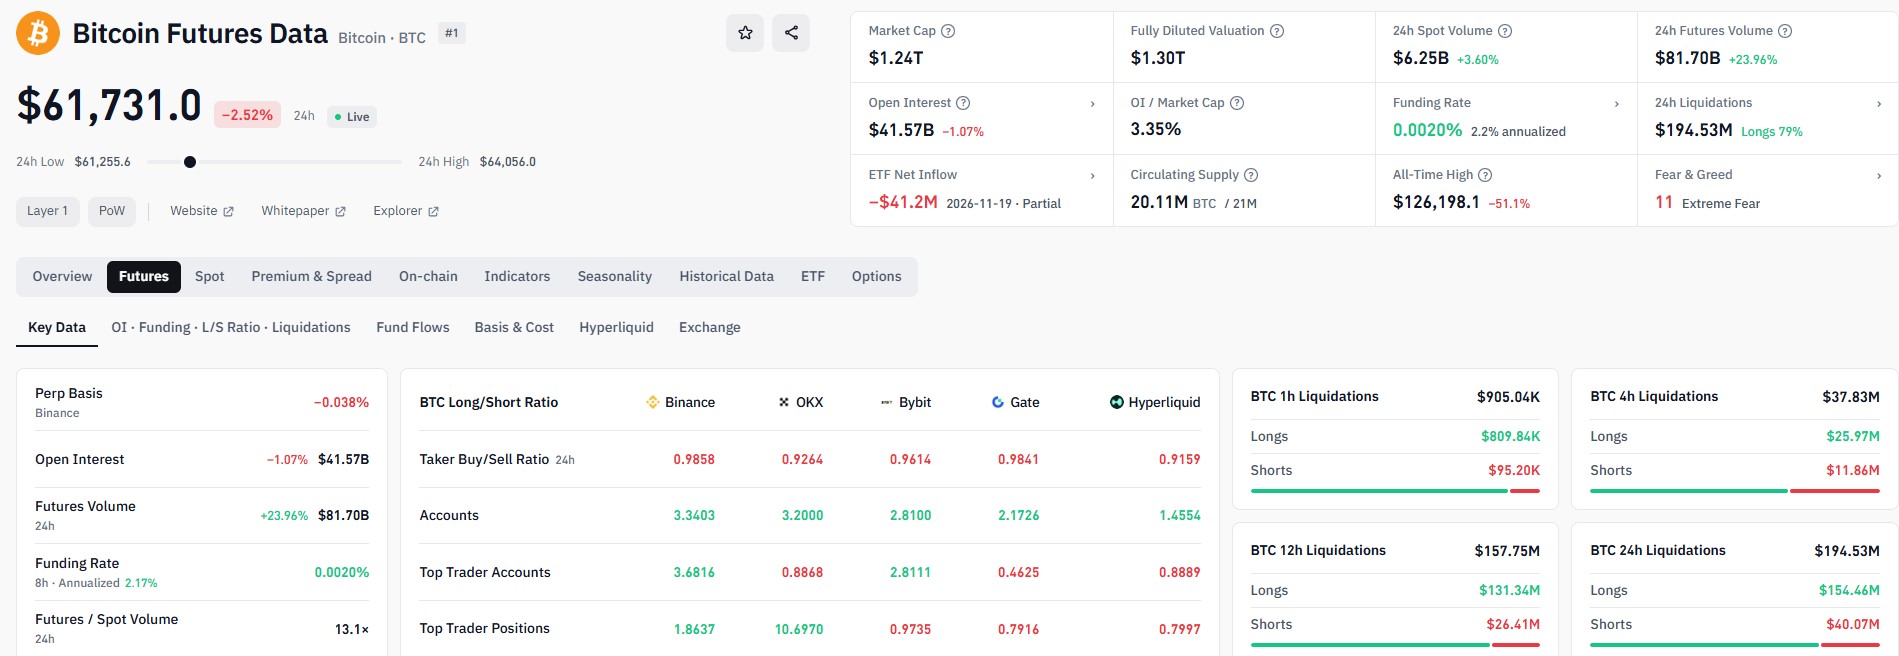
Bitcoin Weekly and Daily Charts
The weekly candle opened at $65,310, hit $65,610 and fell to $61,231. It sits near $61,749, down $3,563 or 5.46%. Price was rejected at the $85,000 to $87,000 zone.
Bitcoin is under all four weekly EMAs. Weekly RSI is 35.81, with its signal line at 53.99.
A rising trendline from late 2022 runs near $60,000 to $62,000. Bitcoin is on it now.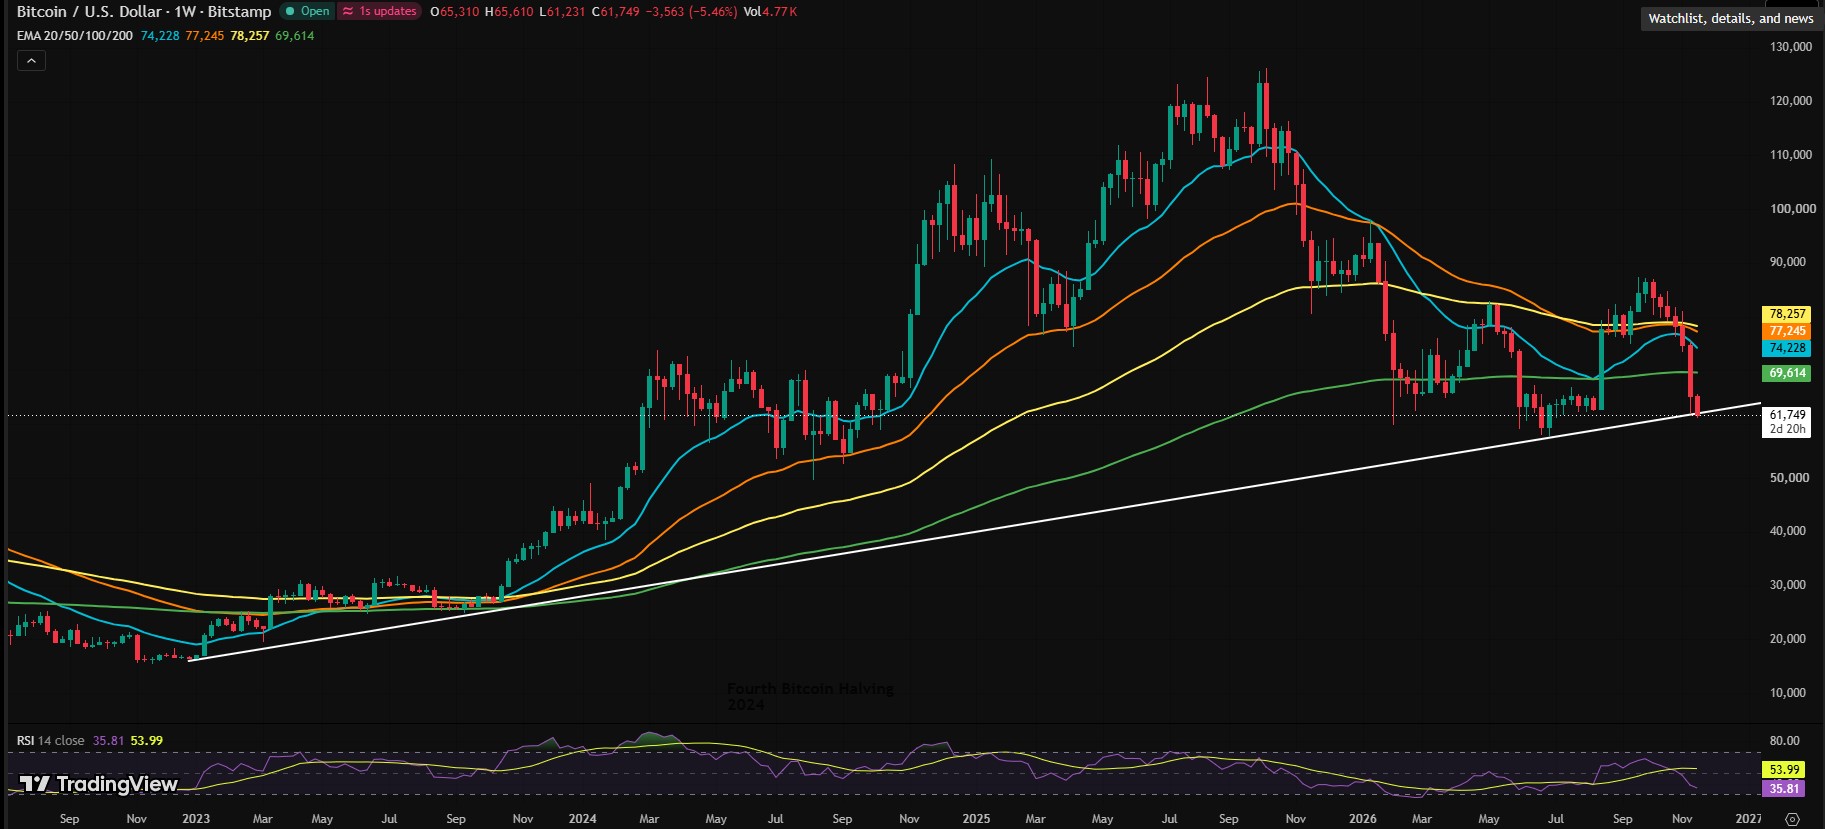
On the daily chart, price opened at $61,910, reached $62,549 and sits at $61,760, down 0.25%. Daily RSI is 20.32, deeply oversold, with its signal line at 27.90. Resistance sits at $84,000 to $86,000.
What Is the Death Cross on Bitcoin?
A death cross happens when a short-term average falls below a long-term one. Traders see it as a sign of weak momentum. The classic version uses the 50-day and 200-day simple averages.
Bitcoin's daily 50-day EMA is $74,571. The 200-day EMA is $75,411. The shorter line is below the longer one, a death-cross style setup.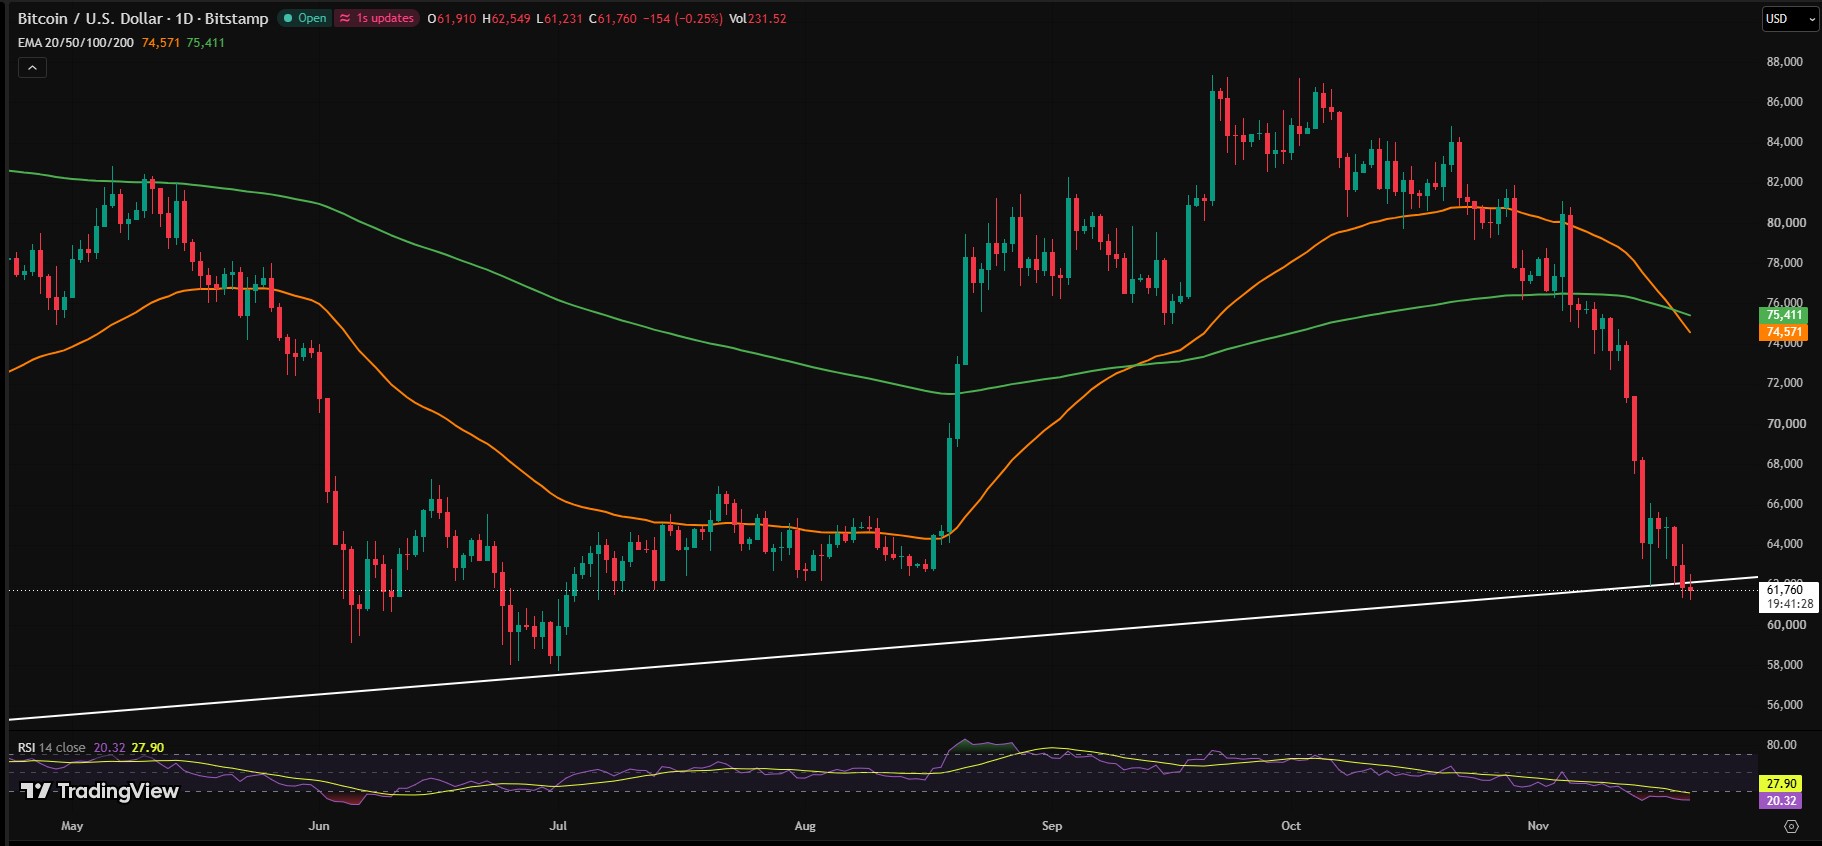
The gap is only about $840. Price is far below both, near $61,760.
The weekly chart tells a similar story. The 20, 50 and 100-week EMAs sit at $74,228, $77,245 and $78,257. The 200-week is $69,614. Price is under all of them.
A death cross lags price. It confirms a fall that has already happened. It does not promise more.
Level | Price (USD) | What it means |
Weekly bounce zone | 69,500 to 74,000 | Target if buyers defend the trendline |
Daily resistance | 68,000 | Stronger hurdle |
Daily recovery zone | 64,000 to 66,000 | First bounce area |
Trendline support | 60,000 to 62,000 | Key decision zone |
Daily supports | 58,000 and 56,000 | After a daily close below 60,000 |
Weekly downside | 55,000 and 50,000 | After a weekly close below 60,000 |
Could Bitcoin Follow Gold and Silver?
Bitcoin shares the Fed and dollar pressure. It is below every major EMA, and ETF money is leaving.
But it is already 29.3% off its peak. Daily RSI is near 20, and funding is only slightly positive. Oversold readings often lead to short bounces. A bounce is not a bottom.
Peter Brandt shared a cycle chart. He says every Bitcoin bull phase ended with a drop of at least 75%. His chart covers 2011, 2013, 2017 and 2021, with bull phases of 938, 1,526, 1,421 and 1,463 days. It marks $37,629, about a 70% fall, as a possible low. It is a pattern, not a promise.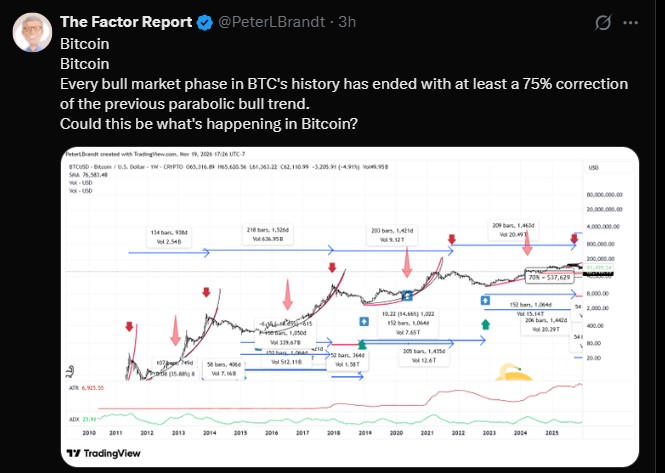
Peter Schiff posted that the next crash will be "much bigger" than 2008. He says gold should not have fallen, while Bitcoin has not fallen enough. He calls gold's drop a chance to buy and Bitcoin's a chance to sell.
He also says falling gold signals deflation, with stocks and real estate set to fall more. He thinks the Fed would then pivot. These are his views, not facts.
Gold Price Analysis: Weekly Chart Points to $2,820
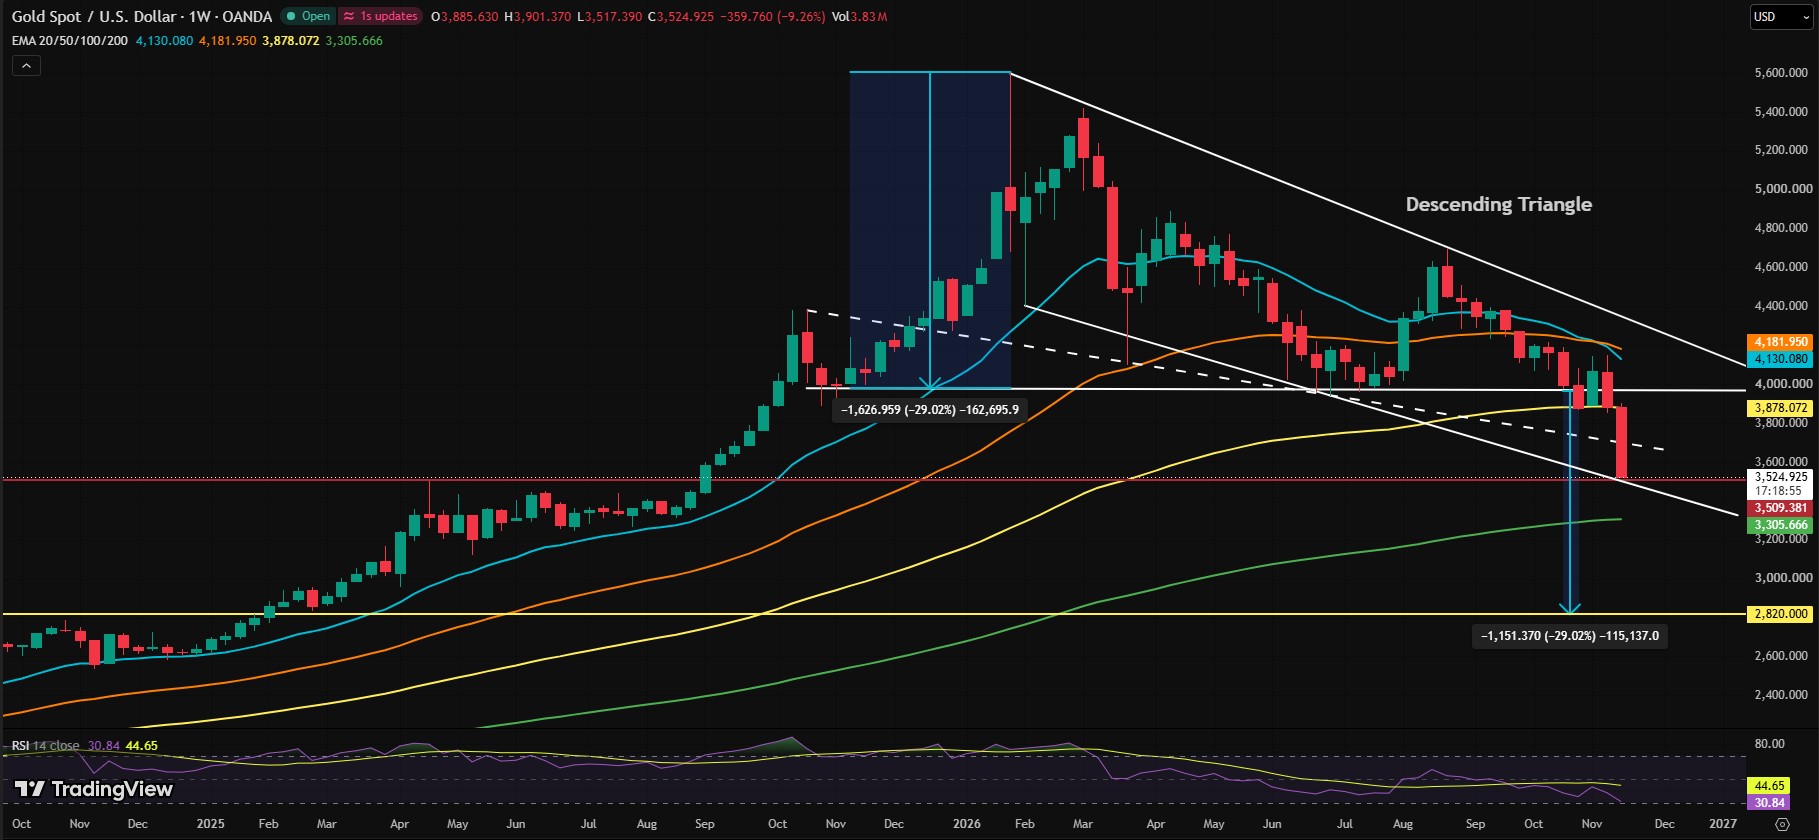
The weekly candle opened at $3,885.63, hit $3,901.37 and fell to $3,517.39. It closed near $3,524.93, down $359.76 or 9.26%.
Gold's record high was near $5,600 in January. The chart shows a descending triangle. Gold broke flat support near $4,000 and sits on the lower falling trendline, near $3,509.
The measured move is a 29.02% drop, about $1,151. That points to $2,820. It is a projection, not a sure target.
Weekly RSI is 30.84, with a signal line at 44.65.
Level | Price (USD) | What it means |
50-week EMA | 4,181.95 | Upper resistance |
20-week EMA | 4,130.08 | Resistance |
Broken support | About 4,000 | Now resistance |
100-week EMA | 3,878.07 | First hurdle for a bounce |
Trendline / week low | 3,509 / 3,517.39 | Key support |
200-week EMA | 3,305.67 | Next support |
Pattern target | 2,820 | If selling continues |
Silver Price Analysis: Wedge Breaks, Brandt Eyes $29.755
The weekly candle opened at $48.654, touched $49.04 and fell to $41.168. It closed near $41.369, down $7.367 or 15.12%.
Silver peaked near $121 in January. It broke a falling wedge and lost the 200-week EMA. Weekly RSI is 29.26, with a signal line at 42.43.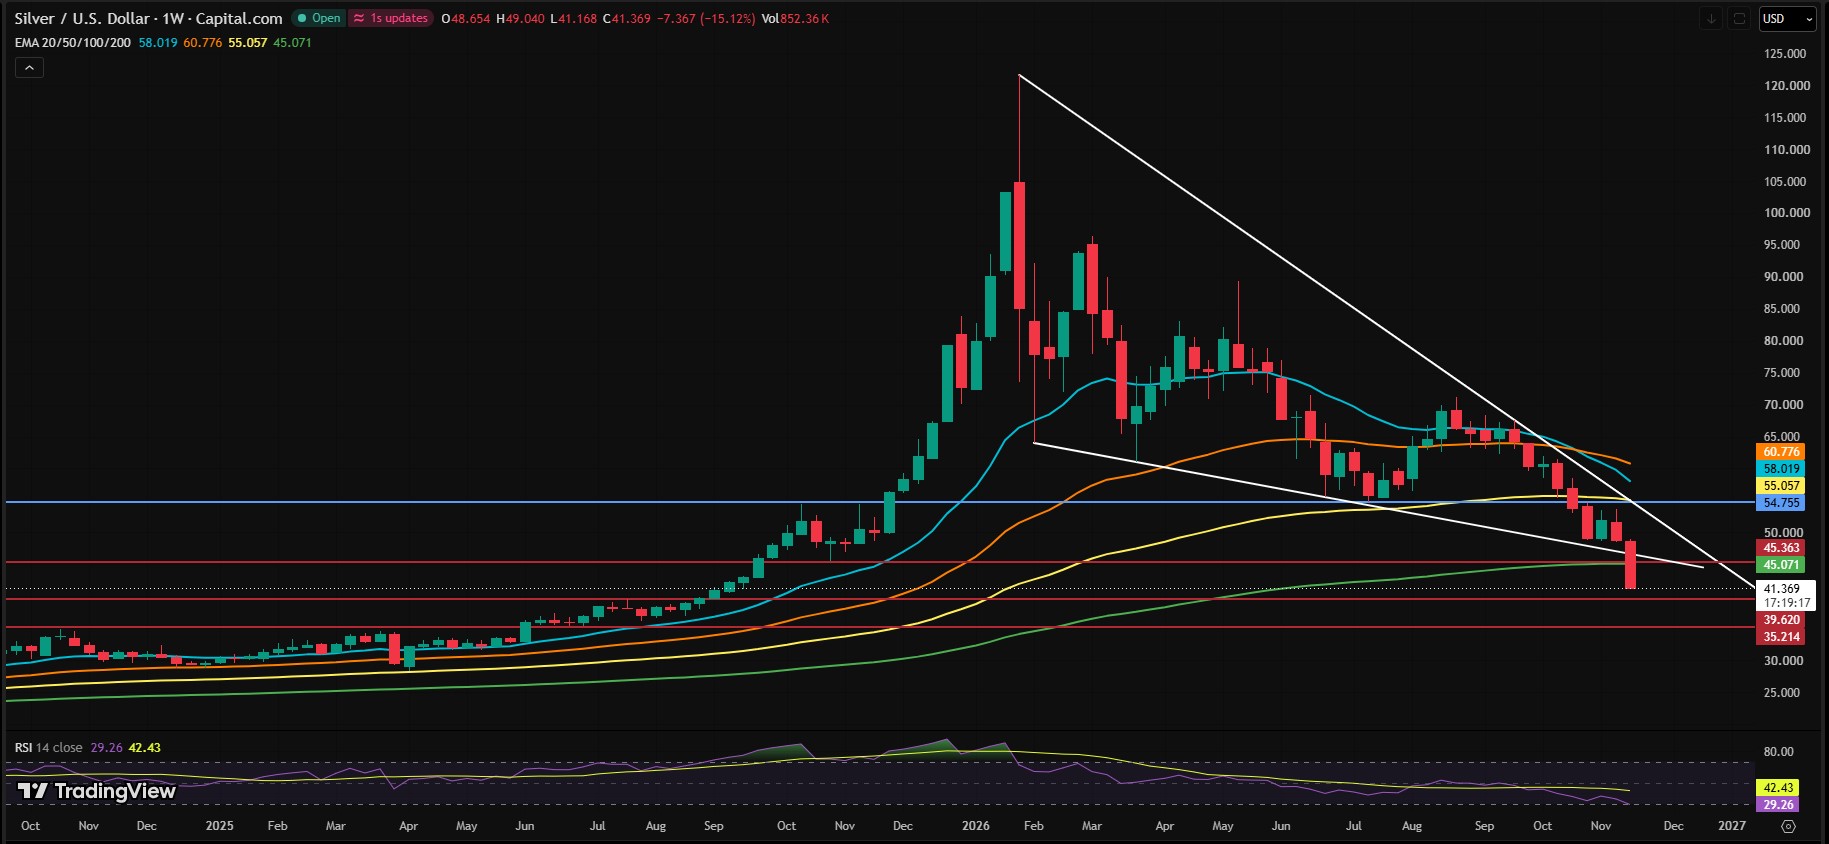
Peter Brandt expected $50 to hold, and $48 at worst. His futures chart (near $43.31) shows a 47.469 average, ATR of 2.245 and ADX of 47.06. It projects a low near $29.755.
He says silver is about $15 from the all-in global cost of production. Miners can keep working at a loss for many reasons.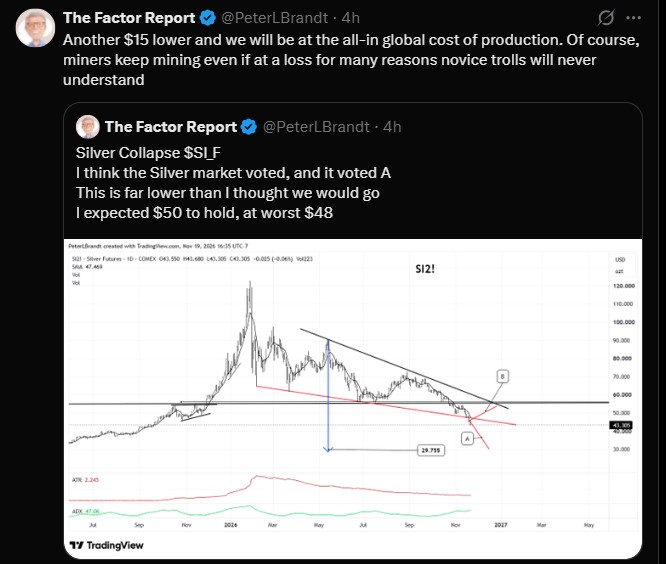
Level | Price (USD) | What it means |
20 / 50 / 100-week EMA | 58.019 / 60.776 / 55.057 | Resistance above |
Blue horizontal line | 54.755 | Major resistance |
Broken support | 45.363 | Now resistance |
200-week EMA | 45.071 | Lost, now resistance |
Support | 39.620 | First support below |
Support | 35.214 | Next support |
Brandt projection | 29.755 | Chart-based downside |
What to Watch Next
The Fed meets again next month. A hawkish tone could keep the dollar firm.
For gold, the line is $3,500. For silver, it is $39.62 below and $45.36 above. For Bitcoin, it is the $60,000 trendline.
Gold and Silver have fallen fast, and Bitcoin may follow or may not. Waiting for clear closes may be wiser than guessing.
Disclaimer
This article is for information only and is not financial, investment or trading advice. Gold, silver and crypto prices are volatile, and chart levels and projections are not guaranteed outcomes. You can lose money. Do your own research and speak to a licensed financial advisor before making any decision.